
Orlando Housing Market Update: 7% Rates Are Back, but This Is Not 2023
Mortgage rates have returned to late 2023 levels. The difference this time is supply. Orange, Seminole, Osceola and Lake counties hold thousands more homes for sale, and that is splitting Central Florida into a steadier core and softer outer markets.
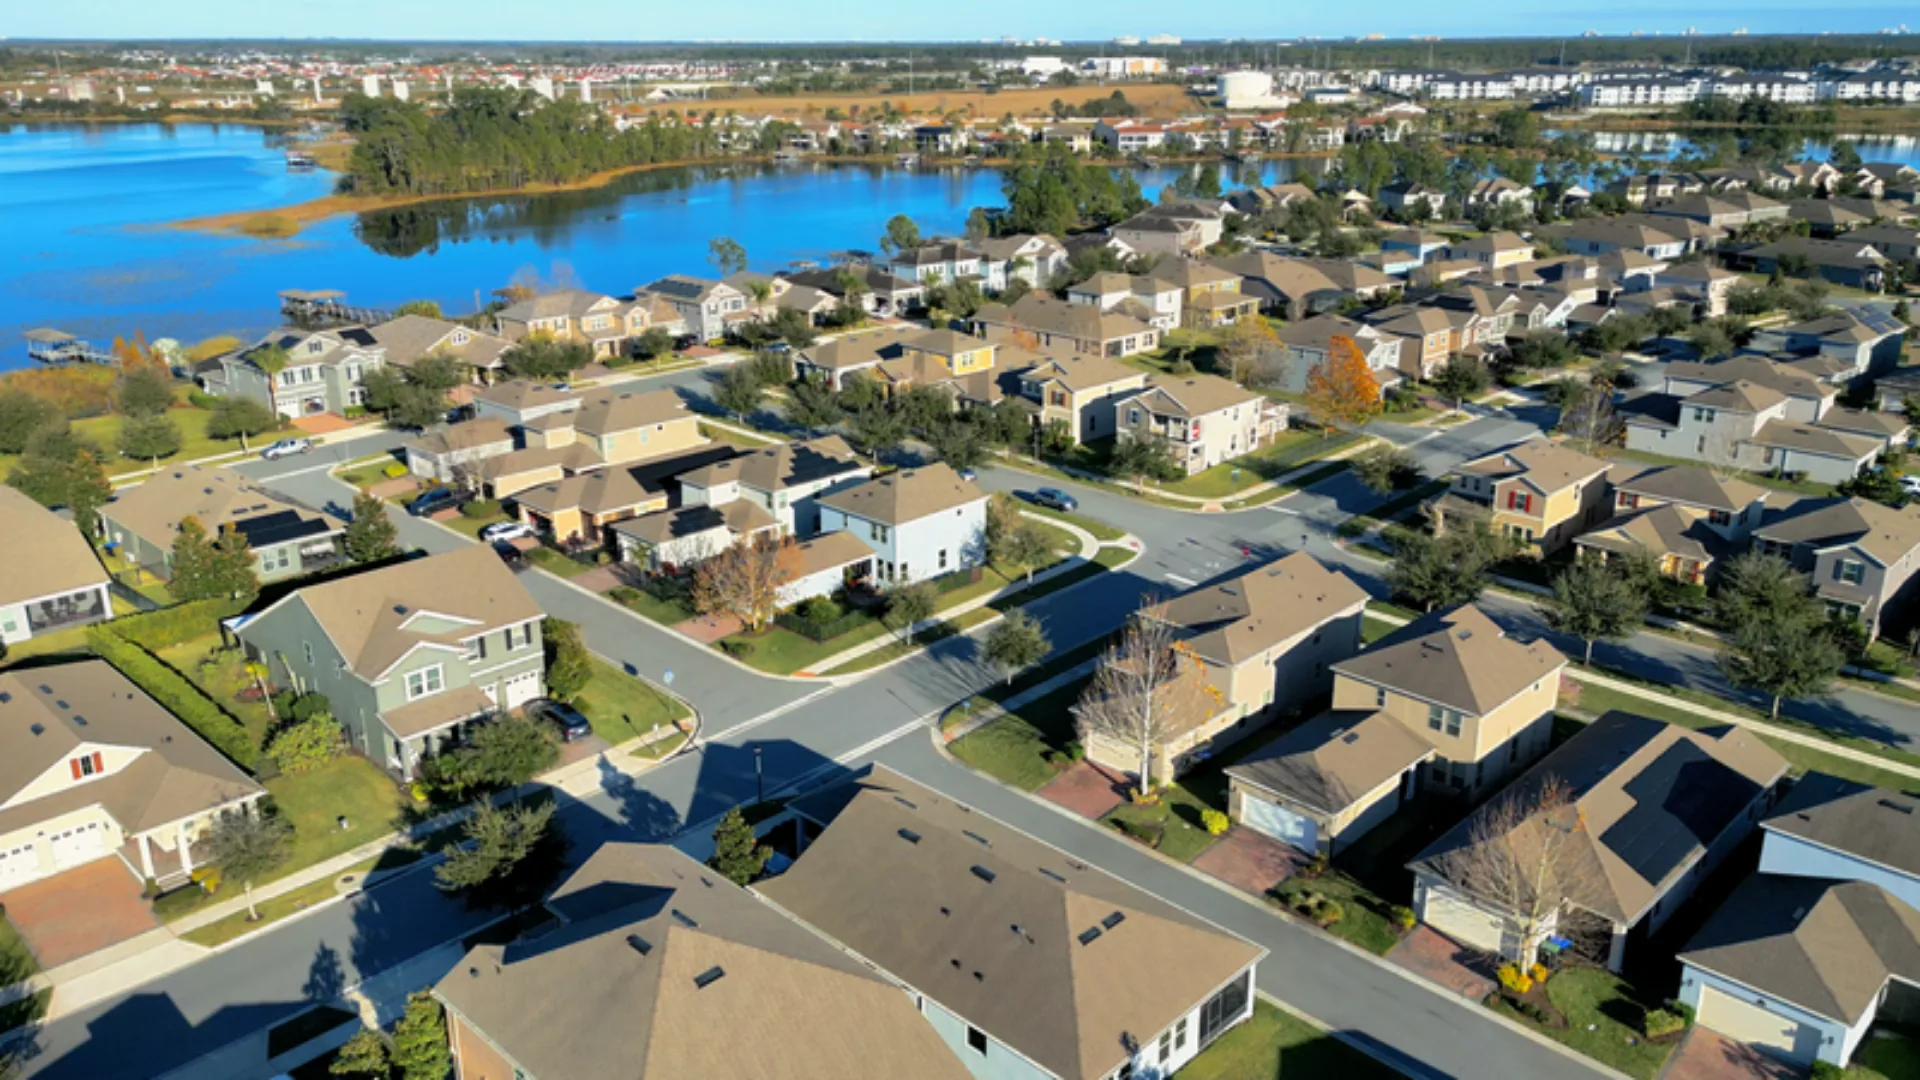
Rates near 7% met a far deeper supply of homes this fall across Orange, Seminole, Osceola and Lake counties.
Image: Jared Jones Team
What to Know
3 shifts behind this update
Jared Jones compared September 2026 Stellar MLS data with October 2023, the last time rates ran this high.
Rates crossed 7% again. Freddie Mac’s 30-year average rose from 6.71% on September 3 to 7.28% on October 1, then 7.40% by October 15, 2026.
Supply is far deeper. Active listings in Orange, Seminole, Osceola and Lake counties are up 68% from October 2023, to 16,835 homes.
2 markets, not 1. Orange and Seminole medians sit above 2023 levels, while Osceola and Lake have slipped below them.
This Orlando housing market update comes down to a single contrast. Freddie Mac’s 30-year average hit 7.28% on October 1, 2026, close to the late 2023 spike, yet active listings across Orange, Seminole, Osceola and Lake counties are 68% higher than in October 2023. Buyers have choices this time, and that changes how prices respond.
Jared Jones, Broker Associate, frames the story in 2 sentences. The 2023 market showed what 7% rates do when homes are scarce. The 2026 market is showing what they do when buyers can compare, negotiate and walk away. The numbers below come from his September 2026 Stellar MLS pull and Freddie Mac’s weekly rate survey.
Why did mortgage rates jump back above 7%?
The climb was steady rather than sudden. Freddie Mac’s 30-year fixed average was 6.71% on September 3, 2026, rose every week through September, crossed 7% on September 24 for the first time since January 2025, and reached 7.28% on October 1. It then printed 7.40% on both October 8 and October 15. A year earlier the same survey sat at 6.34%.
That reversal stings because the year started on a different track. Rates briefly dipped below 6% this spring, and Jared notes that many forecasts expected 2026 to hover near 6%. For context on how that spring market looked, see this first quarter 2026 look at Orlando prices and listings.
Jared’s reminder for anyone waiting on the Federal Reserve: 30-year mortgage rates track the 10-year Treasury yield far more closely than the Fed’s short-term rate. When bond investors worry about inflation and government borrowing, mortgage rates can rise even while the Fed is talking about cuts.
Freddie Mac 30-year fixed rate, weekly average
Bars start at 6.00% so the weekly change is visible. Gray bar is the same week 1 year earlier.
Source: Freddie Mac Primary Mortgage Market Survey, weekly 30-year fixed averages for the dates shown (October 2, 2025 through October 15, 2026), via Freddie Mac releases and the FRED MORTGAGE30US series.
How much does the rate jump cost Orlando buyers?
Jared runs a simple example. A $500,000 home with 20% down means a $400,000 loan. At last year’s 6.34%, principal and interest come to about $2,486 a month. At 7.28%, the same loan runs about $2,737, roughly $251 more every month. That is before property taxes, insurance, HOA dues and, in many Florida communities, a CDD assessment, which buyers can confirm by learning how to find the CDD line on a property tax bill.
The sharper way to see it is to hold the payment steady. A buyer capped at $2,486 a month can now borrow about $363,000 instead of $400,000. With 20% down, that is a home near $454,000 instead of $500,000, a $46,000 drop in buying power. Measured against the sub-6% rates of spring, Jared puts the loss closer to $63,000. He estimates 70% to 80% of buyers across Orlando and Florida use financing, so this hits most of the market.
At the newer 7.40% reading from October 15, the same $400,000 loan works out to about $2,770 a month. Markets rarely close that gap with a single clean price cut. In Jared’s view, it gets absorbed through some mix of lower prices, seller concessions, builder rate buydowns, larger down payments, buyers stepping down a price tier, or simply fewer closings.
What makes this Orlando housing market update different from 2023?
Inventory. In October 2023, Jared notes, rates ran roughly 7.5% to 7.8%, and Central Florida had very few homes for sale. Most owners held mortgages near 3% and had no reason to move, so listings stayed thin and prices held. Today, sellers have already come back. Combined active listings in the 4 counties rose from about 10,000 in October 2023 to 16,835 in September 2026.
Active listings, October 2023 vs. September 2026
Gray bars show October 2023. Crimson bars show September 2026.
Source: Stellar MLS data via InfoSparks, as presented by Jared Jones in his October 2026 video. Active listings and months of supply are September 2026 readings compared with October 2023 and September 2025.
| County | Active listings, Oct 2023 | Active listings, Sept 2026 | Change | Months of supply, Oct 2023 | Sept 2025 | Sept 2026 |
|---|---|---|---|---|---|---|
| Orange | 3,565 | 6,406 | +80% | 2.4 | 4.9 | 4.9 |
| Seminole | 1,110 | 1,845 | +66% | 2.0 | 3.9 | 3.9 |
| Osceola | 3,388 | 5,094 | +50% | 4.3 | 7.1 | 7.5 |
| Lake | 1,937 | 3,490 | +80% | 2.9 | 5.3 | 5.1 |
Source: Stellar MLS data via InfoSparks, as presented by Jared Jones in his October 2026 video. Active listings and months of supply are September 2026 readings compared with October 2023 and September 2025.
Raw listing counts tell half the story, so Jared leans on months of supply: how long current inventory would take to sell at the recent pace if no new homes were listed. In his framework, under 3 months leans toward sellers, 3 to 5 months is roughly balanced, homes start sitting longer near 5, and 6 months or more is a buyer’s market.
By that measure, Orange and Seminole roughly doubled from very tight 2023 levels, and Seminole is still on the firmer side. Osceola and Lake each rose about 75%. The nuance most headlines miss is the 1-year view: Orange and Seminole are exactly where they were in September 2025, Lake tightened slightly, and only Osceola loosened, from 7.1 to 7.5 months. This is an inventory plateau at a higher level, not a fresh surge. The open question is whether the newest rate jump pushes supply higher this fall.

Same rate neighborhood as 2023, far deeper supply in 2026.
Image: Jared Jones Team
Why is the Orlando housing market splitting into 2 markets?
Prices show the split. Against the last rate spike, Orange and Seminole medians are still above October 2023, while Osceola and Lake have given back their gains and then some. A single metro-wide median hides that, which is why the county view matters.
| County | Median price, rolling 3 months to Sept 2026 | vs. 1 year earlier | vs. Oct 2023 | Closed sales, Sept 2026 vs. Sept 2025 | Showings per listing, Oct 2023 to Sept 2026 |
|---|---|---|---|---|---|
| Orange | $440,000 | +0.6% | +4.8% | -18.1% | 5.7 to 3.7 |
| Seminole | $419,995 | +1.6% | +3.2% | -8.9% | 6.5 to 4.6 |
| Osceola | $379,900 | -2.3% | -2.8% | -11.9% | 3.5 to 2.4 |
| Lake | $370,000 | -1.3% | -1.3% | -11.4% | 3.8 to 2.7 |
Source: Stellar MLS data via InfoSparks, with showing data as labeled in the video, presented by Jared Jones in October 2026. Prices are rolling 3-month medians through September 2026.
Seminole: the firmest footing
Seminole has the lowest supply of the 4 counties at 3.9 months, the most showings per listing at 4.6, a median up 1.6% from a year ago and closed sales down only 8.9%. Jared is careful to say that does not guarantee appreciation, but it shows the deepest buyer demand relative to what is listed.
Orange: stable prices, slower speed
Orange County’s median is up about half a percent from last year and 4.8% above 2023, yet September closings fell from 1,339 to 1,097, an 18.1% drop, and pending sales were down 5.3%. Showings per listing are about 35% below 2023. Price stability is masking a real slowdown in how fast homes sell, and conditions vary widely by ZIP code, as this breakdown of 3 south Orlando ZIP codes shows.
Osceola: where buyers have the most leverage
Osceola carries 7.5 months of supply, the most in the region and still rising, along with a 2.3% annual price decline and just 2.4 showings per listing. Demand has not disappeared: pending sales were up 4.8% year over year. Jared reads that as sellers adjusting and new, lower comparable sales forming. For a closer look at a single Osceola market, see this St. Cloud growth and housing shift report or Jared’s ZIP-by-ZIP St. Cloud video on YouTube.
Lake: more supply, and more demand
Lake County is the most interesting of the 4. Prices are down 1.3% and supply sits at 5.1 months, but pending sales rose 6.3% from last year and run about 24% above October 2023, the strongest pending growth in the group. Jared sees the same pattern in Clermont, Groveland and Minneola: more homes, steady absorption and buyers following the metro west toward lower entry prices. His Clermont housing and growth update goes deeper.
Why the split? Jared points to several factors rather than 1 cause. Osceola and Lake have more new construction, and builders compete directly with resale sellers using rate buydowns and incentives that land hard in payment-sensitive price ranges. Parts of Osceola also carry more investor and short-term rental ownership. Buyers who want a lower entry price can browse Jared’s tour of daily life in Clermont for the lifestyle side of that tradeoff.

Orange and Seminole are holding value better than Osceola and Lake in the September 2026 data.
Image: Jared Jones Team
Why aren’t Orlando home prices falling harder?
Higher rates, far more listings, fewer showings and fewer sales would normally pressure prices more. Jared’s answer is what he calls the affordability ladder. Search-based migration data for the first quarter of 2026 ranked the Orlando metro as the top destination for relocating house hunters nationally. Jared’s review of the same tracker showed New York, Miami, Washington, Boston and Chicago as the top origins for people searching Orlando. This is search intent, not moving trucks, but it is a useful read on demand.
The price gap explains the pull. Using city-level medians from the same national brokerage data, Jared puts Orlando near $415,000, with the Orlando Regional REALTOR Association showing about $400,000 last month. New York sits near $899,000, Boston $859,000, Washington $684,000 and Miami $650,000. Only Chicago, near $426,000, comes close. For a buyer arriving from those markets, Orlando does not feel expensive, and that puts a floor under demand that many metros lack.
Miami deserves its own note. Jared cites listings there taking about 116 days to sell and closing roughly 5% under list price. The equity math usually works for a move to Orlando, but the timing math trips people up. Buyers coming from slower markets may need a contingency, a bridge loan or a plan to rent out their current home before they can commit here. This guide to the real costs of moving to Orlando in 2026 covers the rest of that planning.
The ladder runs the other way too. The top places Orlando residents are searching are Ocala, Palm Bay, Jacksonville, Sarasota and Gainesville, all inside Florida. Ocala sits near $285,000, Palm Bay $330,000, Jacksonville $309,000 and Gainesville $267,000, so 4 of the 5 are cheaper than Orlando. Sarasota is the exception. People are not necessarily leaving a bad market. Many are stepping further down the same ladder, and higher rates push more buyers down it.
Valuation data Jared subscribes to adds context. Statewide, Florida homes measured about 33% overvalued against local incomes in 2022 and about 6.5% today. That gap closed mostly through flat prices and rising incomes, not a 27% price drop. The catch is that buyers purchase a payment, not a price-to-income ratio, so valuations look healthier even as affordability got worse. Orlando-area median asking prices were down nearly 2% year over year in August, gentler than the roughly 5.25% drop in August 2024, and nearly 1 in 3 listings had a price cut. Jared calls it a slow grind, not a free fall, a theme he also covered when asking whether a 2026 crash was coming.
What should buyers and sellers do after this Orlando housing market update?
Sellers: price for the market you are entering, not the spring market and certainly not 2021. Your first few weeks bring the most attention, and overpricing usually means chasing the market down with reductions while buyers watch. In Osceola and parts of Lake, plan for concessions and price against current competition, including builders nearby that Jared says are advertising rates in the 4% to 5% range through buydowns. Condition matters more than it has in years. In Orange and Seminole, updated, well-presented homes priced correctly are still drawing showings and offers.
Buyers: know which market you are in. You may have more negotiating leverage than in years, especially in Osceola and Lake, so ask about seller concessions, compare builder incentives and shop lenders. Jared cites a recent national estimate that rate differences across lenders, credit profiles and down payments can be worth about $28,000 in buying power. Most of all, buy a payment that works today. If rates fall later, treat a refinance as a bonus, not the plan. Local snapshots like the October 2026 Winter Garden market numbers and the Horizon West village-by-village update help narrow the picture, and the Winter Garden and Horizon West local guide hub collects the rest.
Because the sharpest part of the rate move landed at the very end of the September reporting window, most of it is not in this data yet. Jared is watching October and November pending sales, showings, price reductions and months of supply to see whether this turns into a price adjustment or mostly stays a slowdown in transactions.
Orlando market by the numbers
Rate figures are Freddie Mac weekly averages. County data is Stellar MLS for September 2026 as presented by Jared Jones. Payment math assumes a $400,000 loan with 20% down.
A light real estate read
County medians are a starting point, not a verdict. Inside each county, the gap between a resale street and a new-construction phase a few miles away can be larger than the gap between counties, because builder buydowns change the monthly math. 2 homes with the same list price can also carry very different HOA and CDD costs.
The practical read is to price and shop at the neighborhood level. Look at recent closed sales and active competition within a short radius, check how long comparable homes have been sitting, and compare the full monthly payment rather than the sticker price.
The Takeaway
Rates near 7.3% to 7.4% are familiar, but the market they landed on is not. With listings 50% to 80% above October 2023 depending on the county, Orange and Seminole are holding value while losing speed, and Osceola and Lake are absorbing more of the adjustment. Demand from higher-cost markets is still flowing in, filtered through affordability.
Knowing which of those markets you are buying or selling in is the most useful number right now.
FAQ
Is the Orlando housing market crashing in October 2026?
The September 2026 Stellar MLS data Jared Jones reviewed does not show a crash. Rolling 3-month median prices were up 0.6% in Orange County and 1.6% in Seminole County from a year earlier, and down 2.3% in Osceola County and 1.3% in Lake County. The bigger change is speed, with closed sales down 9% to 18% year over year.
What is the current 30-year mortgage rate?
Freddie Mac’s weekly survey put the 30-year fixed average at 7.40% on October 15, 2026, up from 7.28% on October 1 and 6.34% a year earlier. Rates change weekly, so check the latest Freddie Mac release before budgeting.
Which Orlando-area county gives buyers the most negotiating room?
By the numbers, Osceola County. It had 7.5 months of supply in September 2026, the most of the 4 counties, along with 2.4 showings per listing and a median price down 2.3% year over year. Lake County is also soft on price, but its pending sales are rising.
How much buying power did the rate jump cost buyers?
In Jared Jones’s example, a buyer capped at a $2,486 monthly principal and interest payment could finance a $500,000 home with 20% down at 6.34%. At 7.28% the same payment supports about $454,000, roughly $46,000 less. Measured against the sub-6% rates of spring 2026, he puts the loss near $63,000.
What do months of supply tell you about the market?
Months of supply estimates how long current listings would take to sell at the recent sales pace if no new homes were listed. In Jared’s framework, under 3 months leans toward sellers, 3 to 5 months is roughly balanced, and 6 months or more leans toward buyers.
External Links & Related Reading
Official rate data and research behind this update, plus related guides and videos from the Jared Jones Team.
- Jared Jones Team on YouTube: Something just changed in the Orlando housing market
- Freddie Mac: Mortgage rates average 7.28%, October 1, 2026
- Freddie Mac: Mortgage rates average 6.71%, September 3, 2026
- Federal Reserve Bank of St. Louis FRED: 30-year fixed rate mortgage average (Freddie Mac data)
- Stellar MLS: Market statistics and reports
- Redfin: Migration report, first quarter 2026
- Also cited in the video: Reventure App valuation and asking-price data (subscription), and a Realtor.com estimate of rate-shopping value. Neither was independently verified for this post.
- Related: Clermont housing market and growth update
- Related: Free Florida housing market report
- Related: 7 Orlando master planned communities compared on price and fees
Find out which market your home is really in
County averages only go so far. For a street-level read on pricing, competition and payments, call or text 407-706-5000 or email info@jaredjones.com.