6 Key Highlights for the Orlando Housing Market in 2026
The Orlando housing market is not telling one simple story in 2026. Some areas are tightening, some are balanced, and some are giving buyers real leverage. The key is knowing which submarket you are actually in before you believe the national crash headlines.
Orlando Is Not Showing a Broad Crash
Orlando’s median sale price has stayed mostly flat, moving from about $381,000 in 2023 to roughly $400,000 in 2026. That is a market pause, not a market collapse.
Inventory Is Tightening Again
Orlando inventory was running 40% to 60% higher year over year in 2024, but by spring 2026, active inventory has been running below last year’s levels in many areas.
Price Cuts Are Not as Scary as They Sound
Around 25% to 26% of Orlando listings are seeing price cuts, but the pre-pandemic market often ran closer to 28% to 31%. Price reductions are not automatically a crash signal.
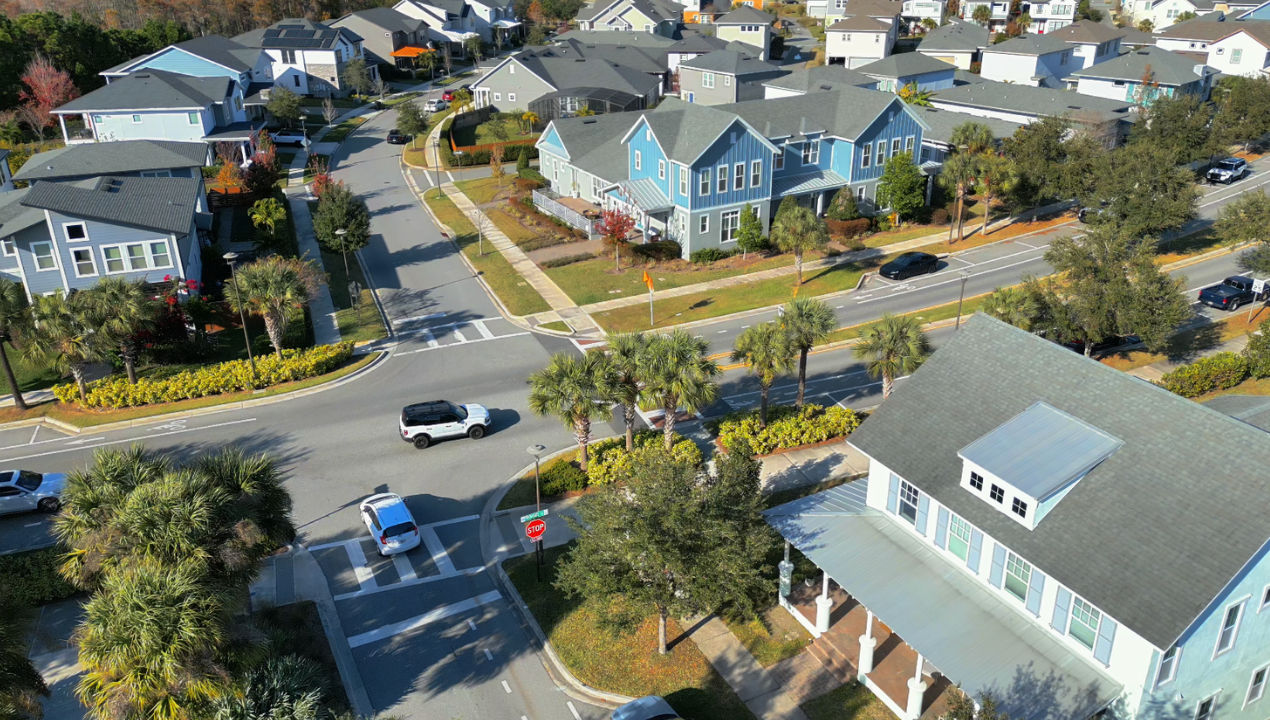
The Strongest Areas Are Still Supply-Constrained
Areas like Winter Park, College Park, Windermere, Dr. Phillips, and the Butler Chain corridor remain stronger because they have lifestyle demand and limited new construction competition.
Buyer Leverage Is Showing Up in the South
Buyers may find more negotiating room in South Kissimmee, Osceola County, Davenport, and parts of Southeast Orlando, especially on homes sitting past the 68-day mark.
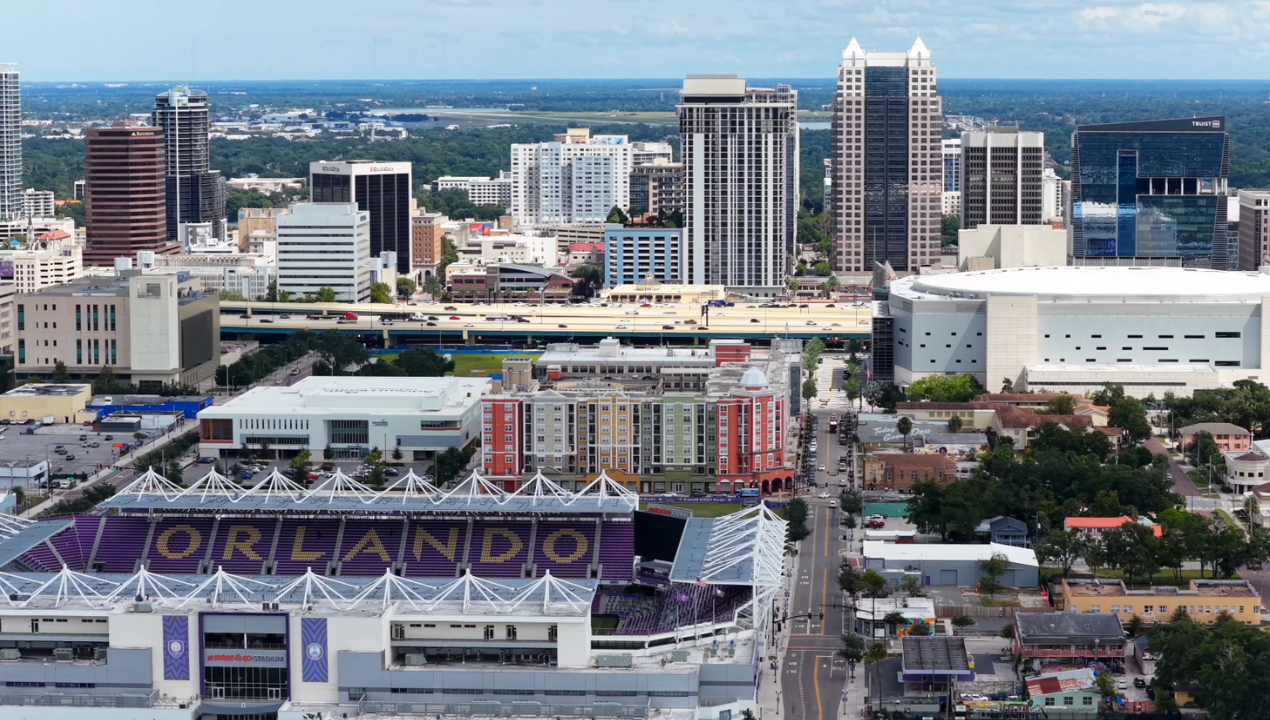
Orlando Is Different From Coastal Florida
Orlando still has insurance pressure, but it does not carry the same coastal risk profile as markets like Miami, Tampa, Cape Coral, or Sebastian. That difference matters when reading statewide Florida headlines.
Is the Orlando Housing Market Going to Crash in 2026?
The Quick Answer
No — the Orlando housing market is not showing a broad crash in 2026. The data points to a split market. Orlando’s median sale price moved from about $381,000 in 2023 to $398,000 in 2024, $405,000 in 2025, and roughly $400,000 in 2026. That is flat, not collapsing. But the opportunity depends heavily on the submarket. Winter Park, College Park, Windermere, and Dr. Phillips remain tighter and more supply-constrained. South Kissimmee, Davenport, Osceola County, and parts of Southeast Orlando are softer, with more buyer leverage and longer days on market.
For more than 23 years, I’ve watched Central Florida buyers and sellers react to national headlines that often do not match what is happening on the ground in Orlando. After nearly 4,000 closed transactions and more than 200 personal flips, I can tell you this: the 2026 Orlando market is not one single story.
A buyer in Winter Park is playing a different game than a buyer negotiating in the Davenport short-term rental corridor. A seller in College Park has a different pricing strategy than a seller in South Kissimmee. The real question is not whether Orlando is crashing. The better question is: which part of Orlando are you talking about, and what does the local data say right now?
Is Orlando Inventory Rising or Falling in 2026?
Direct answer: Orlando inventory is tightening in 2026 compared with the bigger inventory surge of 2024 and 2025. Active inventory is no longer running dramatically above the prior year. In fact, the recent data shows fewer unsold homes than last year, while new listings are also running lower.
For most of 2024, Orlando had 40%–60% more homes on the market than the year before. That mattered. Buyers had more choice, sellers had more competition, and homes that were overpriced started to sit.
By the back half of 2025, that year-over-year inventory gap started shrinking to roughly 20%–30%. By spring 2026, Orlando had shifted into a different pattern: active inventory was running negative compared with last year.
That matters because buyers feel this before the headlines catch up. They may see listings online, but when they get serious in areas like Winter Park, College Park, Windermere, or Winter Garden, the number of truly good, well-priced homes can feel much thinner than the charts suggest.
Orlando Active Inventory Trend
Year-over-year inventory pressure has cooled from the 2024 surge and moved below last year’s level by spring 2026.
Orlando’s active inventory surge has cooled. After running well above the prior year in 2024, inventory moved below last year’s level in spring 2026.
More homes were on the market year over year during much of 2024.
The inventory gap started shrinking as seller supply slowed down.
Fresh supply was running about 10% below the same time last year.
Inventory Takeaways
- Orlando’s 2024 inventory surge has cooled.
- Active inventory is now below last year in recent 2026 data.
- New listings are about 10% lower than the same time last year.
- Less fresh supply means the best homes can still move quickly.
- The tightness is not equal across every zip code, especially when comparing Winter Park, College Park, Windermere, Winter Garden, Davenport, and South Kissimmee.
Are Orlando Home Prices Actually Dropping?
Direct answer: Orlando home prices are not crashing. The median sale price has been mostly flat over the last few years, moving from about $381,000 in 2023 to $398,000 in 2024, $405,000 in 2025, and roughly $400,000 in 2026. That is a slight pullback, not a collapse.
The mistake many buyers make is waiting for a dramatic 30%–50% crash across Orlando. That is not what the local data is showing. What we are seeing is more like a long affordability pause, where prices flatten while wages, time, and potentially lower rates slowly improve buyer math.
That does not mean every seller is safe. A seller in South Kissimmee or parts of the Davenport short-term rental corridor may need to negotiate more than a seller in Winter Park or Dr. Phillips.
But market-wide, Orlando is not behaving like a collapse market. It is behaving like a market that had a major affordability shock, absorbed higher interest rates, and then started sorting itself by location, inventory, condition, and seller motivation.
Orlando Median Sale Price Trend
The market has been mostly flat since 2023, with a slight pullback in 2026 rather than a sharp decline.
Orlando’s median sale price has been mostly flat since 2023, with a slight pullback in 2026 — not a market-wide crash.
Orlando pricing reflected the pressure of higher rates and affordability strain.
The market pushed higher, but price growth remained measured.
This was the highest point in this four-year snapshot.
A modest pullback, showing flat pricing rather than a sharp drop.
| Year | Approximate Median Sale Price |
|---|---|
| 2023 | $381,000 |
| 2024 | $398,000 |
| 2025 | $405,000 |
| 2026 | $400,000 |
Are Orlando Price Cuts a Warning Sign or Normal Market Behavior?
Direct answer: Orlando price cuts are not automatically a crash signal. In 2026, about 25%–26% of listings are seeing a price cut. That sounds high until you compare it with the pre-pandemic Orlando market, when roughly 28%–31% of homes commonly needed a price adjustment to sell.
This is where national headlines can mislead buyers and sellers. A headline may say price cuts are hitting alarming levels across the country, but Orlando’s local baseline matters more than the national story.
A healthy market can still have price reductions. In fact, a normal Orlando market has historically included many sellers making adjustments after testing the market.
The difference in 2026 is location. A price cut in Davenport or South Kissimmee may mean something different than a price cut in College Park or Windermere. The local supply picture decides whether that cut creates real buyer leverage.
Price Cut Share vs. Normal Orlando Baseline
Current Orlando price cuts are below the pre-pandemic range discussed in the market update.
Orlando’s current price cut share is below the normal pre-pandemic range discussed in the video.
About one in four listings is seeing a price adjustment in the current market.
A normal Orlando market historically included a higher share of price reductions.
Price Cut Takeaways
- Current price cuts are around 25%–26% of Orlando listings.
- Pre-pandemic Orlando commonly ran around 28%–31%.
- A price cut is not automatically a crash signal.
- Softer submarkets still require sharper pricing, especially in Davenport and South Kissimmee.
- Stronger areas can remain competitive if the home is priced correctly, especially in College Park and Windermere.
Why Does Orlando Look Different From Tampa, Miami, and Cape Coral?
Direct answer: Orlando looks different because its demand drivers, insurance costs, and supply patterns are not the same as coastal Florida markets. Orlando has population growth, job growth, tourism, inland insurance advantages, and fewer direct coastal storm risks than places like Miami, Tampa, Cape Coral, or Sebastian.
One number explains a lot: the Orlando metro went from roughly 2.6 million people in December 2021 to about 2.9 million people by December 2024. That is approximately 300,000 people in three years who needed somewhere to live.
That type of population growth creates structural pressure underneath the market. It does not protect every property. It does not mean every seller can overprice. But it does help explain why Orlando is not moving in lockstep with weaker coastal or investor-heavy markets.
Insurance is another major difference. Orlando’s average insurance number discussed in the video was around $3,500 per year, compared with much higher figures cited for markets like Tampa, Sebastian, and Miami. Orlando is not immune to Florida insurance pressure, but it is not South Florida either.
Orlando’s Population Growth Is a Major Difference
Orlando’s recent growth helps explain why the market is not behaving like every other Florida metro. More people moving into the region creates demand pressure, especially in supply-constrained areas.
Approximate Orlando metro population at the start of the comparison.
Approximate Orlando metro population after three years of growth.
Roughly a mid-sized American city worth of people added to the metro.
Florida Insurance Cost Comparison
Orlando still has insurance pressure, but the average burden discussed in the video is meaningfully lower than several coastal Florida metros.
Orlando’s insurance costs are still a major factor, but the market is not carrying the same average burden as several coastal Florida metros.
| Market Factor | Orlando | Coastal / Heavier-Risk Florida Markets |
|---|---|---|
| Insurance pressure | Real, but generally lower than many coastal markets | Often much higher |
| Population growth | Strong recent metro growth | Varies widely |
| Storm exposure | Inland market | Greater coastal exposure in many areas |
| Inventory pattern | Tightening in recent 2026 data | Some markets remain more supply-heavy |
| Buyer demand | Still present but rate-sensitive | More uneven depending on location |
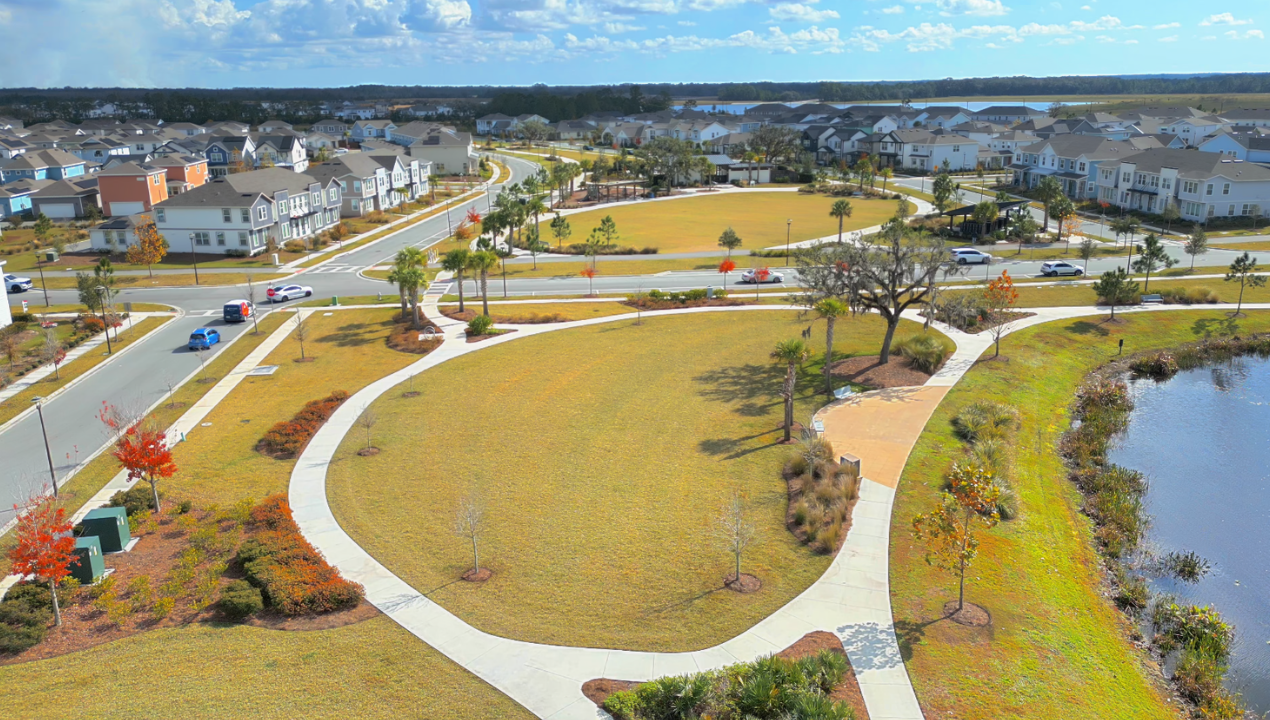
Which Orlando Neighborhoods Are Still Holding Up Best?
Direct answer: The Orlando neighborhoods holding up best are generally established, supply-constrained, high-demand areas with limited new construction competition. That includes Winter Park, Downtown Orlando, College Park, Windermere, Dr. Phillips, and the Butler Chain corridor. These are not usually bargain-hunting markets.
These areas have a different kind of buyer demand. People are not just buying square footage. They are buying location, school access, lake access, walkability, proximity to jobs, lifestyle, and long-term scarcity.
That scarcity matters. You cannot easily recreate Winter Park’s 32789 core, the College Park lifestyle, or the Butler Chain corridor with a new subdivision 35 minutes away. That is why these areas often hold their floor better when affordability gets tight.
For sellers in these areas, the message is not “name your price.” It is price correctly and do not let national headlines scare you into thinking your market is the same as every soft Sunbelt market. For buyers, the message is different: you may not find a steal, but you may be buying into one of the more stable slices of Central Florida.
Strong-Market Indicators
Limited New Construction Competition
Established areas like Winter Park and College Park are not easily replaced by new subdivisions farther out.
High Lifestyle Demand
Buyers are paying for access to restaurants, lakes, trails, schools, job centers, and the daily routine these locations create.
Established Neighborhood Identity
Areas like Windermere, Dr. Phillips, and Downtown Orlando already have name recognition and buyer demand.
Stronger Resale Appeal
When buyers want a proven Orlando location, these neighborhoods often stay on the list even when rates and affordability are challenging.
Better Long-Term Scarcity
The best-positioned homes in supply-constrained areas tend to hold value better because there are fewer direct replacement options.
Fewer True Replacement Options
A buyer can find more square footage farther out, but they usually cannot duplicate the exact location profile of these core Orlando submarkets.
Where Do Orlando Buyers Have the Most Leverage in 2026?
Direct answer: Buyers have the most leverage in South Kissimmee, parts of Osceola County, the Davenport short-term rental corridor, Southeast Orlando, and FHA-heavy southern markets. These areas generally have more supply, longer days on market, more price cuts, and more sellers who may need to negotiate.
This is where the national housing narrative has more truth inside the Orlando metro. Not everywhere, but in these specific pockets. Some of this is tied to short-term rental inventory, investor pullback, and sellers who bought based on stronger tourism or rental assumptions.
The short-term rental corridor near Disney has its own challenges. Some homes are hard to show because they are occupied by guests. Some owners do not want to pull the property from the rental pool and lose income. That can create stale inventory and weaker buyer urgency.
In these areas, days on market becomes one of the most important buyer tools. A listing that has been sitting 68+ days may be in a very different negotiating position than a fresh listing that came out correctly priced.
Orlando Market Buckets by Buyer Leverage
Orlando is not one market. Buyer leverage changes dramatically between established supply-constrained neighborhoods and softer southern corridors.
Stronger / Tighter Markets
Winter Park, Downtown Orlando, College Park, Windermere, Dr. Phillips, and the Butler Chain corridor.
Less bargain hunting, stronger seller position, and fewer true replacement options.
Mixed Markets
Horizon West, parts of South Lake County, Downtown St. Cloud, and surrounding areas.
More choice, some negotiation, and real competition from builder incentives.
Softer / More Buyer Leverage
South Kissimmee, Osceola County, Davenport STR corridor, and Southeast Orlando.
More supply, longer days on market, more price cuts, and better negotiating room.
Buyer leverage is strongest in softer southern corridors and weakest in established, supply-constrained Orlando neighborhoods.
| Market Bucket | Example Areas | What It Means |
|---|---|---|
| Bucket 1: Stronger / tighter | Winter Park, Downtown Orlando, College Park, Windermere, Dr. Phillips, Butler Chain corridor | Less bargain hunting, stronger seller position |
| Bucket 2: Mixed | Horizon West, parts of South Lake County, Downtown St. Cloud and surrounding areas | More choice, some negotiation, builder competition |
| Bucket 3: Softer / more buyer leverage | South Kissimmee, Osceola County, Davenport STR corridor, Southeast Orlando | More supply, longer days on market, more negotiating room |
Buyer Leverage Signs
- The home has been on the market 68+ days.
- The seller has already reduced the price.
- Comparable homes are sitting nearby.
- New construction is offering incentives nearby.
- The property is in a short-term rental-heavy area.
- The seller’s photos, condition, or access are limiting demand.
What Budget Scenarios Should Orlando Buyers Think Through Before Writing an Offer?
Direct answer: Orlando buyers should run budget scenarios based on monthly payment, not just list price. A resale home with no incentives can be more expensive monthly than a higher-priced new construction home with a major rate buydown. Buyers also need to account for insurance, taxes, HOA, CDD fees, and future resale risk.
In a market like Orlando, the same budget can behave very differently across submarkets. A buyer looking in Winter Garden may face tighter inventory and less discounting. A buyer looking in Davenport may find more negotiation room, but also more investor competition and short-term rental risk.
A buyer in Dr. Phillips may pay more for location stability. A buyer in St. Cloud may get more house for the money but must weigh commute, growth, schools, and builder competition.
This is why I do not like buyers making emotional decisions off the listing price alone. The better move is to build several budget scenarios before writing.
Budget Scenarios to Compare Before You Offer
The right Orlando offer strategy is not always about the lowest price. It is about the best total monthly cost, risk profile, and long-term fit.
Resale With No Seller Credit
Compare the price, interest rate, repairs, and insurance to understand the true baseline monthly cost.
Resale With Seller Credit
A seller credit may reduce your cash needed at closing or help buy down the interest rate.
New Construction Incentive
Builder rate buydowns and closing cost help can sometimes lower the payment even if the price is higher.
Stale Listing Offer
Days on market, seller motivation, and condition may create the best chance for stronger negotiation.
High-Demand Neighborhood
You may get less discounting, but a stronger location like Dr. Phillips or Winter Garden may offer better stability.
Before writing an offer, compare the monthly payment, cash needed, incentives, repairs, location strength, and resale risk — not just the list price.
| Scenario | What to Compare | Why It Matters |
|---|---|---|
| Resale with no seller credit | Price, rate, repairs, insurance | Shows the true baseline monthly cost |
| Resale with seller credit | Price plus closing cost help | May reduce cash needed or buy down rate |
| New construction with builder incentive | Rate buydown, closing costs, HOA/CDD | Can lower payment even if price is higher |
| Stale listing offer | Days on market, seller motivation, condition | Best chance for stronger negotiation |
| High-demand neighborhood | Less discounting, stronger location | May offer better long-term stability |
What Buyers Should Not Ignore
- Monthly payment matters more than list price when comparing resale and new construction.
- Insurance and taxes can change the math quickly in different parts of Central Florida.
- HOA and CDD fees matter, especially in newer communities around Horizon West, St. Cloud, and South Lake County.
- Location stability matters in areas like Dr. Phillips, Winter Garden, and Windermere.
- Investor-heavy areas require extra caution, especially around Davenport and short-term rental corridors.
When Is the Best Time to Buy in Orlando in 2026?
Direct answer: If you want the most options, spring and summer are usually the best times to buy in Orlando. If you want the best chance at value, late summer through the end of the year can create better opportunities, especially after school starts and motivated sellers remain on the market.
Spring and summer bring more listings because many families want to move before the next school year. That matters in family-driven markets like Winter Garden, Horizon West, Lake Nona, Oviedo, and St. Cloud.
But more listings also mean more active buyers. You may get better selection, but not always better leverage. The best homes can still attract strong interest if they are priced correctly.
After school starts, inventory can get leaner. But the sellers who stay on market through September, October, November, and December may be more motivated. A seller allowing showings during the holidays is often sending a message: they still want to sell.
Orlando Buyer Timing Strategy
The best time to buy depends on whether your priority is selection, value, or negotiation leverage.
Inventory Starts Building
More sellers begin listing as families prepare for summer moves and the next school year.
Best Selection
Buyers usually see more options in family-driven markets like Winter Garden, Lake Nona, and St. Cloud.
Better Value Window
After school starts, motivated sellers who remain on market may become more flexible.
Motivation Shows
A seller allowing showings around the holidays may be serious about getting a deal done.
Timing Takeaways
- Best selection: spring and summer.
- Better value opportunities: September through December.
- Strongest competition: well-priced homes in top submarkets.
- Best negotiation setup: stale listings in softer corridors.
- Worst strategy: waiting for a market-wide crash that may not come.
What Should Orlando Sellers Do If Their Home Is in a Softer Submarket?
Direct answer: Sellers in softer Orlando submarkets need to price correctly from day one. In areas like South Kissimmee, Davenport, Osceola County, and parts of Southeast Orlando, overpricing can cause the home to sit, which weakens leverage and makes buyers more aggressive.
The first price is usually the most important price. If you come out too high, you may help your neighbors sell while your home becomes the stale listing buyers use as leverage.
This is especially true if your home is competing against new construction, investor-owned homes, short-term rentals, or similar resale listings with price cuts. Buyers can see the options. They know when a property does not line up with the asking price.
That does not mean you give the house away. It means you price based on evidence, condition, competition, days on market, and buyer behavior in your exact pocket of the market.
Do Not Chase 2022 Pricing
Your neighbor’s old sale may not reflect today’s buyer pool, rates, incentives, or competition.
Watch New Construction
Builder incentives can pull buyers away from resale homes if your price is not aligned.
Do Not Wait Too Long
If the market rejects the price for 45+ days, the listing can lose leverage fast.
Seller Strategy List
- Price against today’s active competition, not your neighbor’s 2022 sale.
- Study pending sales, not just closed sales.
- Watch new construction incentives nearby.
- Fix obvious condition issues before launch.
- Make showing access easy.
- Use strong photos, video, and local positioning.
- Do not wait 45+ days to admit the market rejected the price.
What Is Jared Watching Next in the Orlando Housing Market?
Direct answer: The biggest number to watch is active unsold inventory. If Orlando continues running below last year’s inventory levels, the market conversation may shift tighter. If inventory starts rising again, especially in investor-heavy areas, buyers could gain more leverage in specific pockets.
Rates matter too. When mortgage rates get closer to 6%, buyer activity tends to pick up. When rates sit higher, buyer urgency cools even if inventory is tight.
The other thing to watch is investor behavior in Osceola County, Davenport, and the Disney-area short-term rental corridor. If more institutional or international investors decide to sell, that could hit supply quickly in those specific areas.
The mistake is watching only one headline. Orlando buyers and sellers need to watch inventory, rates, days on market, price cuts, new construction incentives, insurance, and local zip-code-level supply.
Metrics Jared Is Watching Next
The next phase of the Orlando market will likely be driven by inventory, rates, and investor behavior in softer submarkets.
Active Unsold Inventory
If inventory stays below last year, Orlando may feel tighter. If it rises, buyers may regain leverage.
Mortgage Rates Near 6%
When rates move closer to 6%, buyer activity can shift quickly across Central Florida.
Investor Exits
Watch Osceola County, Davenport, and Disney-area STR corridors for investor-owned listings.
Price Cut Share
Price cuts help show where sellers are adjusting and where buyers may have more room to negotiate.
Days on Market by Zip Code
A stale listing in Davenport means something different than a stale listing in Winter Park.
Builder Incentives
New construction incentives can pressure resale sellers in areas like Horizon West, St. Cloud, and South Lake County.
The market is not decided by one headline. The real story comes from inventory, rates, investor movement, builder incentives, and zip-code-level supply.
Metrics to Watch Next
- Active unsold inventory vs. last year.
- Mortgage rates near or below 6%.
- New listings volume.
- Price cut share.
- Days on market by zip code.
- Builder incentives.
- Short-term rental investor exits.
- Insurance movement across Central Florida.
FAQ: Orlando Housing Market 2026
These are the most common questions buyers and sellers are asking about the Orlando housing market in 2026, especially around prices, inventory, buyer leverage, and which submarkets are holding up best.
Is the Orlando housing market going to crash in 2026?
Based on the current data discussed in this market update, Orlando is not showing signs of a broad crash in 2026. The median sale price has been mostly flat, moving from about $381,000 in 2023 to around $400,000 in 2026. That is not a collapse. But Orlando is not one market. Winter Park, College Park, Windermere, and Dr. Phillips are still more supply-constrained, while South Kissimmee, Davenport, and parts of Osceola County are softer. The real answer depends on the exact neighborhood, price range, condition, and competition.
Are Orlando home prices dropping right now?
Orlando home prices are slightly softer compared with 2025, but they are not falling dramatically across the metro. The median sale price discussed in the video was roughly $405,000 in 2025 and about $400,000 in 2026. That is more of a flat market than a crash. Buyers hoping for a massive discount in Winter Park or Windermere may be disappointed. Buyers looking in Davenport, South Kissimmee, or parts of Southeast Orlando may find more negotiation room, especially on homes that have been sitting for a while.
Why is Orlando different from other Florida housing markets?
Orlando is different because it has strong population growth, inland insurance advantages, tourism, job growth, and limited supply in many established neighborhoods. The Orlando metro grew from roughly 2.6 million people in late 2021 to about 2.9 million people by late 2024, which added major housing demand. Orlando also does not carry the same coastal insurance profile as places like Miami, Tampa, Sebastian, or Cape Coral. That does not make Orlando risk-free. It simply means national Florida headlines often fail to separate Central Florida from coastal or investor-heavy markets.
Where are Orlando sellers still in the strongest position?
Sellers are generally in the strongest position in established, high-demand areas with limited new construction competition. That includes Winter Park, Downtown Orlando, College Park, Windermere, Dr. Phillips, and the Butler Chain corridor. These areas tend to have stronger lifestyle demand, better scarcity, and fewer true replacement options. A well-priced home in one of these markets can still move quickly. But sellers still need to be realistic. Even in strong areas, buyers will reject a home that is overpriced, poorly presented, or out of line with competing inventory.
Where do buyers have the most negotiating power in Orlando?
Buyers have the most negotiating power in softer southern and investor-heavy corridors, especially South Kissimmee, Osceola County, Davenport, Southeast Orlando, and parts of the short-term rental corridor near Disney. These areas can have more supply, longer days on market, and more price cuts. A listing that has been sitting 68+ days may give buyers more room to ask for a lower price, closing cost help, repairs, or other concessions. The key is not assuming every home is negotiable. The leverage depends on the seller’s motivation, time on market, and local competition.
Should I buy a resale home or new construction in Orlando in 2026?
You should compare both, especially in growth corridors like Horizon West, South Lake County, St. Cloud, Davenport, and Osceola County. Some builders are offering rate buydowns, closing cost help, and incentive packages that may improve the monthly payment. But new construction may also come with HOA fees, CDD fees, lot premiums, and longer timelines. Resale homes may offer better locations, mature neighborhoods, or larger lots. The smart move is to compare the full monthly cost, not just the list price. That means taxes, insurance, HOA, CDD, incentives, repairs, and resale risk.
Is now a good time to buy a home in Orlando?
It can be a good time to buy in Orlando if you have a clear strategy and are focused on the right submarket. If you are looking in Winter Park, College Park, Windermere, or Dr. Phillips, you should expect tighter inventory and less discounting. If you are looking in Davenport, South Kissimmee, or parts of Osceola County, there may be more room to negotiate. The bigger issue is your timeline. If you plan to own for four to seven years, you can make a more balanced decision than someone trying to buy and resell in two years.
When is the best time of year to buy in Orlando?
If your top priority is selection, spring and summer usually give Orlando buyers the most options because many sellers list before the next school year. That matters in family-driven areas like Winter Garden, Lake Nona, Oviedo, and St. Cloud. If your top priority is value, late summer through December can be better because some sellers who remain on the market after school starts are more motivated. The tradeoff is that inventory can be leaner in the fall and around the holidays. The best timing depends on whether you value choice or negotiation more.
What should I do if I need to sell in a softer Orlando market?
If you are selling in a softer Orlando market like South Kissimmee, Davenport, Osceola County, or parts of Southeast Orlando, your first price matters more than ever. Do not price based on what your neighbor got in 2022. Price based on active competition, pending sales, condition, new construction incentives, and current buyer behavior. If your home sits too long, buyers may assume you are overpriced or motivated. That weakens your position. You do not need to give the home away, but you do need to launch with evidence, not hope.
What number should Orlando buyers and sellers watch most closely?
The most important number to watch is active unsold inventory. If Orlando keeps running below last year’s inventory levels, the market may tighten and buyers could feel more urgency. If inventory rises again, especially in Davenport, Osceola County, South Kissimmee, or Southeast Orlando, buyers may regain leverage in those pockets. Mortgage rates are the other major factor. When rates move closer to 6%, buyer activity tends to increase. When rates stay elevated, buyers become more cautious even if inventory is limited.

Why Choose Jared Jones?
As a top real estate agent with nearly 4,000 homes sold and over 20 years of experience in the Florida real estate market, I have the expertise needed to help you navigate today’s evolving landscape. Whether you’re looking to buy or sell, my deep understanding of market trends and personalized approach will provide you with the insights and strategies required for success.
Best Realtor in Orlando- Reach Out Today
If you’re ready to make a move in Florida’s real estate market, don’t hesitate to reach out. Contact Jared Jones at 407-706-5000 (call or text) or email info@jaredjones.com for professional guidance and personalized service that will help you achieve your real estate goals.
Trustindex verifies that the original source of the review is Google. My wife and I purchased a home in Kissimmee, Florida and it was by far the best home buying experience we have ever had. This is our 7th home we have purchased. Stephany Cornelius was our Realtor from Jared Jones Real Estate Team and we couldn't have been more pleased. She made the process so easy, less stressful and guided us through every aspect including a very quick closing. I highly recommend Stephany if you're trying to navigate the home buying experience here in Florida.Posted on GoogleTrustindex verifies that the original source of the review is Google. Jared Jones was amazing at helping us pick and getting our dream home. He was very patient and always had an answer to any questions we had. Could not be more thankful for him and his team.Posted on GoogleTrustindex verifies that the original source of the review is Google. Jared and his team were great to work with. Always professional and responsive to every situation that arose. Would love to work with them again on future deals.Posted on GoogleTrustindex verifies that the original source of the review is Google. Jared and Kristen were a pleasure to deal with. Their professionalism and quick responses made the entire closing process smooth and stress-free. I look forward to working with them again on future transactionsPosted on GoogleTrustindex verifies that the original source of the review is Google. Jared was great! We were moving to FL from out of state and he made everything so much easier!Posted on GoogleTrustindex verifies that the original source of the review is Google. Jared was absolutely amazing to work with. I came across his content on YouTube and from the very first time we spoke I knew I wanted to have him handle this process for me. Many realtors try to simply sell you a property and then move on……..not Jared. Jared is numbers driven which to me was extremely important. He guided us into specific areas that we wanted to be and gave us the data to justify our decision making in tandem with his recommendations. He has a unique ability to guide buyers that I really haven’t seen before and for that I’ll always be grateful. He also recommended things outside his scope based on his experience of closing on over 4000 homes which came in handy as we are out of towners. Those things matter most for buyers and Jared ticks all the boxes. Lastly the one thing he said to me that always stood out was that when you purchase a home with him……he comes with the home. That personal competent touch is what makes all the difference. Close your eyes, take his guidance and let him handle everything. Will definitely recommendPosted on GoogleTrustindex verifies that the original source of the review is Google. Best decision we made was to hire Jared to sell our house. We were in awe of the level of professionalism in every aspect from the advertising of the house all the way to closing. Jared was approachable and responded quickly. His team was on top of every detail after the house went on contract. Throughout the entire process we were updated as to what was happening and received clear and accurate answers to all of our questions. Highly recommended for selling or buying because of his knowledge and work ethic.Posted on GoogleTrustindex verifies that the original source of the review is Google. We used Jared Jones to help us relocate to the Orlando area, and we couldn't be happier. Jared is incredibly knowledgeable about the market and provided deep insights during the inspection and negotiation phases, which gave us so much confidence in our decisions. His team also has a very streamlined process for managing closing timelines and tasks with total precision. As out-of-state buyers, having everything handled with such high efficiency was huge for us and made the entire home-buying process a stress-free experience.Posted on GoogleTrustindex verifies that the original source of the review is Google. Jared Jones is a great Realtor. I originally found Jared through his YouTube channel, where he gives incredibly helpful information about Orlando. I can confidently say he is just as good of an agent as he is at providing great info in his videos. We recently relocated from out of state, and he helped us purchase our new home here. His team made the entire process smooth.Posted on GoogleTrustindex verifies that the original source of the review is Google. Jared was a pleasure to work with as we relocated from Virginia Beach to Orlando. I’m a retired Naval Aviator. I have high standards for performance and Jared exceeded every one of those standards. He is wealth of information. He and his team are organized, responsive and effective. His property searches were particularly noteworthy - they were tailored to our specific requirements and produced really great, applicable and attractive results, in stark contrast with many “realty” services that simply hit a price range and have wasted my time with extraneous, undesirable results. His support before, during and after the sale was simply exemplary. His sales (purchase) negotiation on our behalf was fair and effective. His advice throughout was clear, thoughtful and measured. He spoke with the voice of experience. His organization, knowledge, effectiveness and customer support compel my highest possible recommendation. There is no finer Agent in the area. He is the best.Verified by TrustindexTrustindex verified badge is the Universal Symbol of Trust. Only the greatest companies can get the verified badge who has a review score above 4.5, based on customer reviews over the past 12 months. Read more
Search Homes in Orlando, Florida
No Results Found.
Jared Jones Real Estate Team Serving All of Central Florida
- Osceola County
- Orange County
- Lake County
- Polk County
- Seminole County
- Volusia County
- Broward County
- Marion County
- Flagler County
- Brevard County
- Pinellas County
- Hillsborough County