Key Points:
- • Pending sales nationally are at record lows, heavily impacting Volusia County.
- • Volusia County inventory up 50-70% year over year in key areas like Deltona and Daytona Beach.
- • Around 42% of listings in Deltona have undergone price cuts.
- • Median sale prices in Florida have remained flat for two years, reflecting a stable but buyer-friendly market.
- • Many new listings in Volusia are priced below 2023 levels, signaling increased seller motivation.
Volusia County Housing Market: Are Home Prices Dropping?
Orlando market renegades, I hope you are well. Today we are talking about the crazy news headlines. Redfin just came out and reported that pending sales are on the floor like national record lows year over year.
They cited things like the fact that the hurricane just came and paused everything, messed everything up. They also cited the surging HOA cost and the fact that property insurance for people buying homes and those that own them already surging out of control. Many of those things are absolutely true for some of us.
But as I often say, you must keep your eye on the ball depending on where you are in this market, because all of Florida is not treated the same. You had the West coast of the market over on the Gulf side, getting absolutely slammed with rain and floodwaters with multiple back-to-back hurricanes through this summer. And if you’re in a place like Volusia County, you might’ve seen a tornado, but largely you just lost power.
And some of these areas are inland. So are they really suffering the same property insurance fate?
Analyzing Volusia County: What You Need to Know
Today, I want to help you. If you’re looking to buy a home in Volusia County, or if you own one right now, pay attention because every marketplace functions differently in the face of different challenges.
Today, I’m going to hook you up with a deep dive analysis. So you will know exactly what’s going on in Volusia County as we head into the end of 2024 and some predictions for 2025. Let’s get into it.
Months of Supply
All right, Volusia, let’s get into this. What are you looking at? This is the sun stats. This is the back end that only licensed agents can get to, to show you the actual pulse of the data that’s going on by market, by zip code.
And we’re going to get into it right now. Look at this. This is months of supply.
This is probably one of the most important data charts you’re ever going to see on any market. This is a measure that if you take all the homes that are for sale, based on how fast they’re selling every single month, this is the pace of how long it would take to sell off all the homes, which by the way, is between four and five months, four and a half months of supply, dead middle that is elevated. If you’re considering comparing it to the rest of central Florida, the state of Florida, or even the nation four and a half months of supply is typically a marker that showing things are a little bit buyer favored for any market, but definitely this one.
A Look Back: Comparing 2017 to Now
And here’s why the chart over here on the left edge is 2017. January goes all the way till now. This is important because this cycle was your normal in Volusia.
It was around three, 3.3, 3.4, maybe elevated 3.5 and 18 going in 19. It’s now a good bit higher than that. And I say that because we want to see what things were like before this pandemic craze, which center market with 2%, 30 year fixed, everybody and their brother was buying and moving to Florida and outbidding Floridians, everything else.
It was just nuts, right? So this was a very low market in this market here. You were gone. You had no listings in a single month.
If you stop listing new ones, so it’s very low inventory here, but you can see, look at Volusia. It’s largely been on a climb for about two years now. So month after month, nearly every month for several months, Volusia, aside from probably the little midsummer of last year, going into the spring last year, it’s just been on a climb and it’s unabated.
It’s not gone sideways. Really? It’s just getting higher. And that is a high against going back to 2017.
Inventory and Buyer Activity: What's Really Happening?
All right. So the next chart we have is active inventory. And you say, Jared, why did you respond that way when you pulled this graph up? Because look at where inventory is. Usually if months of supply is spiraling off the sponsored by SpaceX shooting off to the moon, usually you see active inventory, the unsold inventory that’s sitting around much, much higher than history. If you take a look at history pre pandemic, before it fell off the table and did something very unnatural, the norms was right where it is now. So it is definitely at the top level of that, but it’s shifted sideways for a few months, but ultimately my gut reaction, and we’re going to invest just so you know, we’re going to investigate this further. Is it still huge seller supply coming buyers back? What did it, what’s happening here? Because this is fascinating to me and we’re going to delve into the story and figure it out, but here’s the deal right now. Most of this year in Volusia, you are seeing anywhere from 50 to 60, nearly 70% more homes on the market than prior year. So yes, recent year of trend is that it’s been growing. The deck is getting stacked and there’s obviously a lot more inventory. Last year, this time you had around 2,200 homes to choose from. If you’re a buyer right now, you got 3000 of them to choose from, and there’s going to be, that’s going to be an all price categories.
What Buyers Should Know Right Now
So if you’re a buyer at the intro level, there’s more to choose from buyer at the top level, more to choose from. And I will believe the buyers probably have the chips stacked in their corner right now in the Volusia County market, where they have a few months ahead of them, where if this stays elevated, they’re going to make it some deals.
New Listing Volume Trends
The next chart we’re looking at, new listing volume, month after month, the measure of people bringing homes in the market. Did it shoot off the charts this year and cause crazy high active inventory that we saw earlier? No, look what’s happening. So last year, which was an anemic record low seller activity in most any market in the U.S. okay. All sellers just backed away this year. You see, it’s a little bit of a renewed interest, but it’s not much higher. So I’m going to tell you some markets like for instance, Lake Mary, you had this boom, like a really nice surge versus last year. And some markets most I would say, cause I watch all of Orlando and I bring this information to you, you see a good elevation against last year. This is really neck and neck. Okay. This isn’t what I would say like, wow, it’s, it’s gangbusters over last year. In fact, the most recent month on record or 14% less new listings than a year prior the month before that was dead flat, barely two tenths of 1% over, which is just even you got to understand too, when you’re looking against last year, are there new households formed? Yes. You have more homes that exist that can be traded year after year. So to see the numbers even flat or negative, you know, you had one up month in July over the past four months, July was the only month that was positive. It was positive 11%. So that’s why you can see there are some gaps that were filled in this year where you had some of these little drop-offs last year in 23, but by and large, this is this month of supply, this transitioning market. That’s clearly more buyer favored. It’s not heavy seller volume. That’s a good thing because if sellers going into 25, turn on the gas, have to sell, lose a job, get remote work canceled, and they work in New Jersey and they got up, travel back and sell the house, a higher inventory level with the numbers and data we already saw will make big problems for this market.
The Future: Predictions for 2025
The other thing I would say too, is when you see two anemic years, look, see, look at the past, look where it is in the past. This is the volume. This is the volume. This is the volume. This is the one. And way more homes exist in Volusia County down here than back here. These numbers should be up here. If you have a resurgence next year, and I think you will, I think 2025 we’ll have a more choice. This is not a crash prediction. You’re gonna have more active inventory, more listings coming, more sellers that need to sell in 2025 than in 24 and in 23. Okay. This phenomenon of sellers.
Rising Costs and Changing Circumstances
Like all the other things I shared in the intro, like rising HOA, rising insurance, rising taxes. Oh, I was holding that property down in Florida because I used to live there in the pandemic. And then my reload got me moved back. I’m not going to rent it out anymore. I was renting it by choice when I moved away, thought it’d be kind of cool. Now it’s kind of expensive. Okay. So life changes things. A lot of landlords in Florida are only landlords to like the second year when they were living in the house and the property taxes had a homestead and kept them protected. You got a bargain. Those taxes are changing. Some of them don’t and they end up on the market.
I think one thing is inevitable is that we are going to see a cycle of more listings. If your buyer volume stays where it is, this will be a problem for the market. Okay. Because clearly when your months of supply is rising and it’s not new listings, it’s not sellers, just rushing homes into the market and it’s still shooting up like that. That is telling me that just my early prediction. I think that usually the cycle that we see and we predict looking at a market going into the spring, we would usually say, well, if a market looks like this now it spring will balance it a little and it’ll be neutral. Okay. So buyers will have a little gain to make some deals right now. Buyers will have some shots at pegging some new lows from November, December.
Winter 2024: A Buyer’s Advantage
By the way, you want to buy a house, call, call a good agent, make sure they’re not just going to emotionally fire you up because you’re in no rush. There’s no reason to rush. And you have to understand that in all of markets like this, 65% of those houses that are actively unsold sitting in active status, they’re not for sale. They’re not in the price range of where they’ll actually pen and sell for. They’re sitting out there lingering and there’s lots of quits, canceled listings, market listings that are sitting there that never go through. You have to be prepared for that. Okay. And a good realtor knows, okay, you don’t need to see all 30 homes because only 10 of them are truly for sale. Let’s find the 10 and let’s find out who’s motivated in the 10 and make a deal in the winter cycle. And that’s a beautiful thing.
Spring 2025: Continued Buyer Favorability
However, I will tell you that as a buyer, you can be patient. I think you can be patient to the spring. I think you’re going to strike better deals seasonally through this winter. This is something for you sellers to pay attention to. You need a good agent too, that can read the market and help you explain what’s coming. But as far as this next step is concerned, I do not think you are going to see a strong balanced market in spring, not even neutral. I think there’s, there’s an argument to be made that buyers might still have an upper hand in Volusia County, depending on where you’re at. Okay. Well, we’ll take a look here in a minute and try to decipher who’s really motivated and what’s softening and what’s not so that you can find these areas. But I was telling you, I don’t, I think there’s going to be, um, a little bit and I’m doing this live. I’m looking at these things with you as I, as I go, I think there’s, there’s, you know, I would expect buyers, most markets I expect be buyer favored for the next couple of months, swing neutral starting February 15, March neutral seller.
Analyzing Price Movement: Median Sale Price
No seller doesn’t have advantage. Buyers have advantage neutral. I still think in this particular market, a lot of areas is going to see a little bit of, um, a buyer advantage in moving season next year. So we’ll see what happens. Next graph I want to show you is median sale price. You see it bumps around. It’s like up 4% down almost three last month, barely up in July plus three plus two half. And then it was positive a couple months through the peak. But look, what does this look like? This is a two year span. This is a really long time all the way back here. Look, this is a gradually appreciating market. And this is just kind of flat. You know, sometimes it’s up, sometimes it’s down.
A Stable Buyer’s Market
And this is where the marketplace starts to slow down, right? Buyers have what kind of market? They have a market where it’s not a fast appreciating market. It’s kind of stable. So the psychology of a buyer, if they don’t have an agent breathing commission down their neck, looks at things as three months from now, it’s not going to be dramatically more expensive, might even be kind of cheap. Burr might, might be a loser month. There’s a chance it’s going to be up or down, right? But it’s not rapidly out of reach. Um, and then they also have more supply. They’re going, this is going to be a careful buyer. Sellers need to understand that you’re going to have buyers that are going to look, they’ll take a week before you may even see an offer from them. Okay. It’s still a bit slower moving market. That’s what happens when you have this kind of thing happening.
Statewide Trends: Florida Holds Flat
And again, you say, well, Jared, is it’s a flat price for two years running? Is that a bet? No, this is everywhere. This is all Florida right now. Florida has largely held flat for two years. Um, and we’re seeing homes in areas where you have high percentage of first time home buyers putting 3% down. They bought a house back here. They only put 3% down. And now we’re seeing a few short sales here and there because they are having to sell now. And the market’s kind of relative to what they paid for it and their cost of selling going on top of what they owe. They’re short to close. They’re actually going to have to negotiate with the bank to take a shortfall because they’re in a hardship situation. They cannot pay out the house and they need to sell it. So we’re seeing that again, it’s not a huge number, but it is happening.
Key Indicators in Volusia County's Real Estate Market
And these are some of the factors that are involved in that. All right. Let me show you some of the indicators that are important for you. Now we’re going to go through some of the more populous areas. We have Deltona down here. We have to land right here. We have Daytona Beach right here. And I want to tell you, if I don’t mention your area, because some of these areas right here, they don’t have a ton of listing activity. So if you go outside of the land, you go outside of Deltona, I’m probably not going to bring up the zip code, but you can look at it. Okay. And you can see if it’s red, there is way more inventory than a year ago. Okay. If it’s orange, there’s a good bit more inventory. It’s elevated. Okay.
Inventory Levels Across Different Areas
So what this means is the darker red that you see, I’m going to show it to you because it’s going to help everybody on this video, but look from Palm Coast up 35%, you come down to Ormond, there’s 33% on the coast, 38% inland Daytona up 28.9, which 28.9 isn’t necessarily crazy high unless they were already climbing for the past three years, 50% plus in one, one, four, look at Deltona. Deltona has the three, two seven, two five market is up 76.7%. The East side of the land, 82% increase year over year West side up 41%. Now on the outskirts of DeLand heading towards Daytona Beach, there is 68.8% more inventory.
A Deeper Dive into Inventory Trends
Now allow me to flip the chart to show you the inventory itself. Okay. So remember, DeLand had enormous growth on the East side. Let’s take a look at how it actually balanced out monthly. Look at this. It’s way up here on the right side. This, my friends, this dotted line is actually your average going back to 2016. If you average all the months pre-pandemic and the lows, here’s your running average. It’s way above an eight-year average, and it’s actually high versus history. Again, you got to keep in mind, there’s probably more housing units. There’s population growth. So once it gets up to here, you are definitely setting records.
But it is on the high side for inventory. Let’s take a look at Deltona. We saw some big numbers from them as well. So in two, seven, five, I’m going to flip to monthly again. Look, even though it is elevated, it is above an eight-year average. There are some months in the past where it was higher back here in 18 and in 19. Now let me show you why some of these percentages might not be telling the whole story.
Remember three, two, one, one, seven, this was Daytona Beach. It was only like 28%. And then you had this area right here was at 50%. Well, take a look. This is what I’m telling you. The reason why, look how crazy this is. This is elevated way over the eight-year average. And there has never been a point in record where they’ve been around 200 units on the market. But the reason why it’s only saying it’s 28% over a year ago is because a year ago it was already at record numbers. So if you look back in time, sometime in like early 2023 inventory here just took straight off every single month. It just got higher and higher. The pace of how fast it’s climbing lately has kind of abated, but it’s got a lot of vertical lines. So that’s the thing is, even though you have to understand the charts I just showed you, some of them you’re like, wow, 80% insane. That one must be way worse off than the one at 20%. It’s not necessarily the case.
Price Cuts: What Buyers Should Know
Now this one was at 50%, but look what’s actually lost some range. They had either some sell-off or some people pulling house off the market in one, one, four, because yes, it’s way over the eight-year average. And yes, before pandemic, they only saw maybe 120 units on the market. Whereas now they’re like 150, 148 last few months, they’ve actually softened to where they are 50% above a year ago.
All right. The next thing I’m going to show you that is a very good opportunity for buyers to understand is price cuts. Okay. Now I’m going to show you two charts in a row that will give you a read on where motivated sellers are, where you might have an opportunity for price stabilization. Again, sellers don’t get upset with me. I’m not taking money out of your pocket. It’s helpful for you to know if you are in a market, you’re going to put your house in the market and everybody around you is cutting the price means you need to pay double close attention to how you price that home.
Price Cuts By Area: Deltona, DeLand, and More
So let’s take a look at the base down here. Now, by the way, you’d say, Jared, if what percentage of listings like down here in Deltona, this zip code and seven to five out of all the listings, 42% of them have price cut. That is crazy high. Okay. That means that there’s a lot of homes lingering and sellers are getting anxious and there’s going to be opportunities for buyers in a market like that. But anything around 20 to 25% is kind of what you see as common across all of Orlando. Okay. So one in five, one in four of all listings, seeing a price cut. Now, if you’re going 33, 34% and above elevated, it’s, it’s cause for concern. It’s caused for buyers to take a close look at the inventory there.
Deland and Daytona Beach Trends
Now just outside of town, going towards Daytona 3, 2, 1, 2, 4, 29%. So getting elevated, look at 3, 2, 1, 1, 7. This is why the whole story wasn’t told. If all you did was look at how much inventory is against last year, it was only 28% growth. You’re like, that’s not a lot, but look how many homes have price cuts there. And remember, when we looked at the actual inventory, it’s way multi-year high elevated with 39.8%. Again, if I don’t cover your area, by the way, if I come up here to Ormond past that Palm Coast, understand if it’s red, it’s elevated. If it’s clear, it’s high. If it’s orange, it’s high.
And again, some of this is against the history of that market. Okay. So the data, this polling saying, Hey, look, this is high for this chart. It’s high for the area, but it’s high for the history of this particular market. So it’s running that as well. 3, 2, 1, 2, 8, 30% price cuts down here. 1, 3, 2 up 30%. And you can see some that aren’t price cutting that much. 3, 2, 1, 1, 8, for example, 15.8% price cuts inland to 3, 2, 1, 1, 4, 25%.
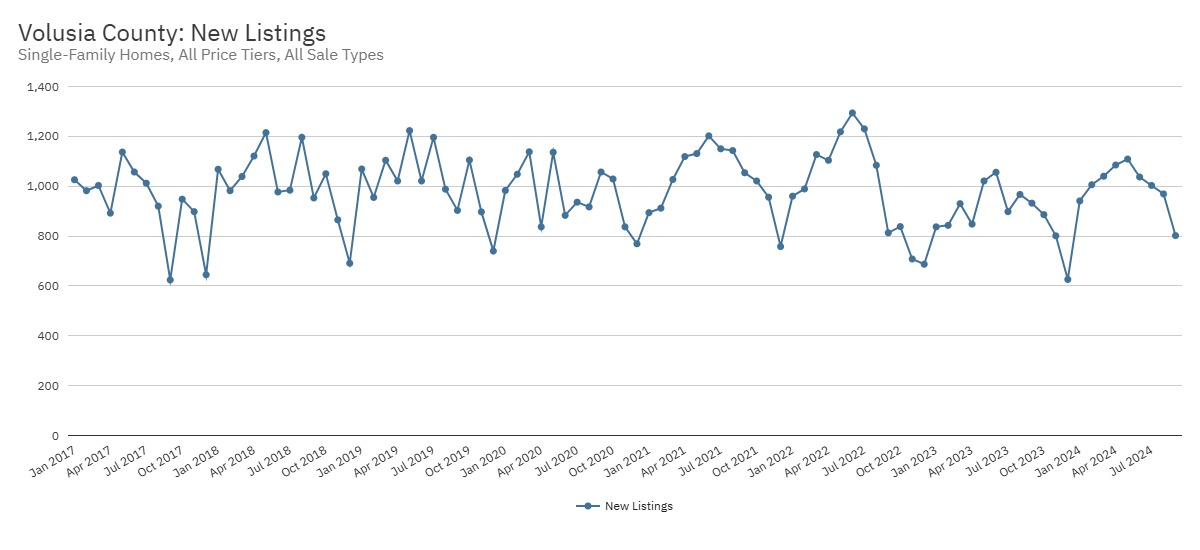
Let me show you another chart. If you’re a buyer or a seller, I’m going to show you where there’s risk spots. Now, how do prices come down? Prices come down in two ways: either one, sellers in unison, as they’re bringing homes to the market, they start their list price low. If they start their list price low, do they reduce it? No, they don’t. They price cut after they start too high and come down.
Now, what this will tell us is are people in a given market starting them negative. This is a very important indicator because understand if you watch my channel, you already know when people start prices on their listings for an entire month, all the listings that come in, if their asking prices are beneath a year ago for all that inventory coming to market the same month, that is a big-time recessionary flag. It is a very rare recessionary flag. And yet do we have it in this market? Yes, we do.
Listing Prices: Volusia County Markets Going Negative
Look at this. So down here, we’re going to start in Deltona’s listings last month were negative 4.3% to a year ago, Orange City, negative 3.1. By the way, this was the hotter side of the market with less price cuts. We’re talking about the East side of DeLand. It’s negative 2%. Remember, if you’re on the East side of DeLand, you’re asking less than a year ago, are you going to sell for full price in that area? No, you’re not. Statistically, you’re going to give back another 3% after you already started beneath last year.
What this tells me the reason, this is why I showed you both charts. I showed you price cuts and you would have looked at DeLand and said on the East side of this isn’t very attractive. There’s only one in four that’s reducing their price. That’s one of the lowest in the region. But now you see that some of your active sellers are getting serious. They’re now starting them again. Very, very rare to see this in any market where your home listing prices are going negative.
Look at the coastal region. Here’s another example. Remember I showed you this particular area on the beach side, 3, 2, 1, 1, 8. It had like only 15% of those listings actually had price cuts, but they’re starting them 11% against last year. Okay. Big time changes happening on the front end.
Why? Because everybody in those small communities, the agents that probably run a lot of those listings, they’re looking around, they have a conversation with the seller and say, look, you have to be very conservative. Again, look at this in 176, which is just north of the zip code we just covered 11.6%. Everybody is on the same sheet of music just inside 3, 2, 1, 3, 6 negative 13%. Holy cow. That’s Flagler Beach. That’s one of the lowest negatives I’ve ever seen looking at Florida data.
And I look at this all the time, negative five, five, 5.5% under 3, 2, 1, 7, 4. Again, the same zip code I showed you a moment ago that has, oh, it’s only 28% year over year. It’s negative 10%.
Interesting. There’s some opportunity possibly if you want to go shopping in Daytona right now. Look at this, the West side of DeLand. And I don’t know if I mentioned it. It’s just a hair below negative. They’re only a little below last year when they probably should be a few percentage points below last year.
Best Realtor in Volusia County - Reach Out Today
If you’re ready to make a move in Florida’s real estate market, don’t hesitate to reach out. Contact Jared Jones at 407-706-5000 (call or text) or email info@jaredjones.com for professional guidance and personalized service that will help you achieve your real estate goals.
Why Choose Jared Jones?
As a top real estate agent with nearly 4,000 homes sold and over 20 years of experience in the Florida real estate market, I have the expertise needed to help you navigate today’s evolving landscape. Whether you’re looking to buy or sell, my deep understanding of market trends and personalized approach will provide you with the insights and strategies required for success.
Stay Ahead of Florida Real Estate Trends
Unlock insider knowledge and stay informed about the latest in Florida’s real estate market! Subscribe to Jared Jones’ YouTube channel for in-depth analysis, current news, and expert insights on real estate trends across the state. Plus, check out my other channel for a deeper dive into the Orlando metro area, where I explore what it’s like to live in and around these vibrant neighborhoods. Whether you’re buying, selling, or just curious about Florida real estate, my videos will keep you ahead of the curve. Hit the subscribe button and stay updated with the most relevant real estate information!
Search Homes in Volusia County
Jared Jones Real Estate Team Serving All of Central Florida
- Osceola County
- Orange County
- Lake County
- Polk County
- Seminole County
- Volusia County
- Broward County
- Marion County
- Flagler County
- Brevard County
- Pinellas County
- Hillsborough County


