• New inventory up by 20-30% year-over-year, creating a buyer-friendly market.
• 22% of listings have seen price cuts, signaling increased buyer control.
• Median sale prices in Minneola rose 18% year-over-year despite increased supply.
• Major new developments, like Pine Ridge and Whispering Winds, promise high-end living options in scenic Sugarloaf Mountain.
Introduction: Orlando Market Trends
Hey there, Orlando market renegades. I hope you’re well. There have been a swirl of news reports as of late coming out of places like Redfin, pointing to the fact that the Florida market has seen a massive drop in pendings right now. They’re pointing to factors such as the hurricane that just recently came through, mounting HOA costs, the high cost of insurance, all of which are 100% factors in the amount of buyers moving forward into properties right now. But one thing I will have you know, and while I will cover that important headline and article on a different video, the article couldn’t help but point to the fact that out of all the marketplaces, even including Miami, which was really far from the recent hurricanes, Orlando was above them all in terms of not seeing its pending volume stagger. And as interest rates took a momentary drop here in the most recent 45 days, buyers surged in and we’re seeing market activity come back, especially beyond the market cycle.
Exploring Minneola’s Growth
And I’m here today to really take a deep dive into the Minneola marketplace. Minneola is a small market no more. This was the little sleepy town next to Clermont, which itself has been long lauded as a sleepy town, but Minneola has been growing in popularity as it finds itself with a new exit off of Turnpike in the last couple of years and a monstrous amount of growth coming to the beautiful green hillsides of this beautiful area of Central Florida. Today, I’m gonna take you down a brief side road to show you exactly what’s being announced, the growth opportunities in this area coming to the market right now. And then we’re gonna jump into the data so that if you own a house here now, you’re thinking of selling or you’re looking to buy one, you’re gonna have a tight pulse on the market to understand what’s going to happen in the residential real estate market, Minneola, as we go into 2025. Let’s get started.
First up, we’re gonna talk about Tri Pointe Homes. They are going to build a beautiful community at Sugarloaf Mountain. This development is positioned in one of the highest points in Florida, offering scenic views and unique landscape. Now, their community will be called Pine Ridge and will feature 178 luxury lots, ranging in width from 45 to 65 feet. And when we’re talking about new communities, this is one of many, but we also wanna point out Stanley Martin Homes just announced Whispering Winds, which will be another high-end featured community coming to the Sugarloaf Mountain area. And if you’re not familiar, Sugarloaf Mountain looks like Pennsylvania transplanted some of its shorter foothills down here into central Florida, one of the flattest states in the union, and it is a thing of beauty. People love cycling up the green hills there, getting out in nature. Yes, I know if you’re from up north, you’re probably saying you shouldn’t call it a mountain. I get you.
The Minneola City Council approved a denser, redesigned plan for the 325-acre Citrus Grove district.
Citrus Grove and Infrastructure Highlights
Next, we wanna talk about the Citrus Grove development, which is coming just west of Turnpike at Citrus Grove Road. This will be a mixed-use traditional neighborhood. It will include 296 single-family homes, 171 townhomes, and over 1,000 condos and apartments. But beyond that, it will also feature 458,000 square feet of commercial space, an 800-student charter school, and there’s even a church planned for this area. And the cool thing about this is that Clermont and Minneola is kind of low-density. It’s got massive growth, but there’s still a lot of open spaces and things of that nature. You have to have a car to live here. But a community like this, mixed with some walkability to local shops and stores, things of that nature, gives a different, sustainable community feel, which is kind of groundbreaking for this area. There’s not a lot of it.
Healthcare and Market Trends
As well and important to the area, Advent Health is still continuing construction on Minneola Hospital. This is a new four-story facility covering around 204,000 square feet and is set to become a viable healthcare hub for the area. And obviously, as we know, Clermont-Minneola also attracts a lot of folks in retirement. So healthcare demand for this area, beautiful world-class facilities right here is super important. Hey, it’s me, interrupting myself. You considering selling your home? Make one call, that’s all, and put my nearly 23 years of experience and nearly 4,000 homes sold to work for you.
Key Market Overview: Minneola Insights
All right, before I take you into a few key graphs, I’m gonna show you some specific segments where some incredible changes are occurring, things you need to plan for if you own here or you’re looking to buy here. But let’s take a quick overview. This, as you can see right here down the left side of the chart, is many different things like closed sales, how much inventory against prior year. It’s very important when you start to see massive shifts in certain areas to pay close attention to what’s happening in the marketplace. Closed sales up 6%, that’s a good sign. A lot of markets are not trending over last year when it comes to how many homes they’re selling. Cash sales were double this year against last year. Median sale price up 18% year over year. We’re gonna take a closer look at that. Dollar volume up 17%. And I may not show this chart later on, so I gotta tell you, dollar volume is the aggregate of all the homes sold in the particular area, right? So it’s like millions of dollars, whatever’s sold, added together. You gotta understand, a lot of the Orlando markets are struggling to get over last year. Think of it like GDP. If you have all these homes selling, if you’re selling more, you’ve heard me say this before if you watch consistently all the markets I cover, dollar volume being up means you’re positive it’s pro-growth. If it’s going negative, it’s a recessionary sign, okay? So let’s move on.
Examining Active Inventory in Minneola
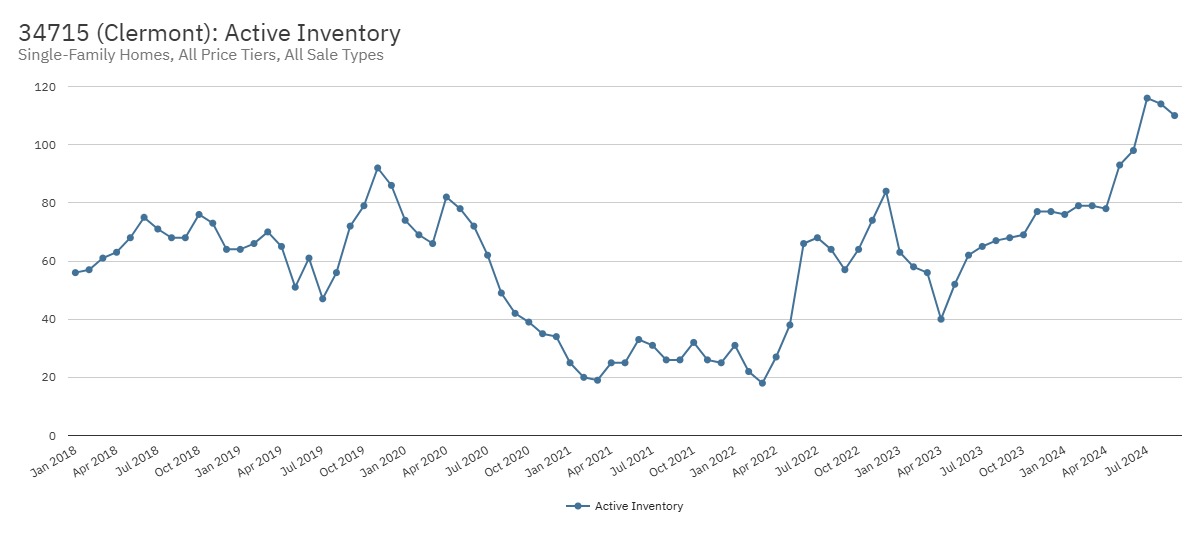
All right, everybody, just so you can understand what I’m looking at, this is 34715. This is the main zip code for Minneola. And on the left side of the graph of this chart, which is active inventory, shows you how many homes we have now in the market versus way back here in 2018, 2019, area we like to call pre-pandemic times before the market all got screwy and obviously random things happened, which happened once in 15 or 20 years.
Here’s the deal and something you understand, the household population, the amount of homes that you can actually sell in this area are dramatically higher on this side of the chart. So even though they are, yes, elevated, they’re elevated to any point of which you can see on this graph going back to 2018, you have to understand there’s just a lot more homes to sell. There’s more environment of people moving in and out.
But look at this. You have 110 homes on the market. That’s the highest point at any year.
It is 70%, it was actually back in July, middle of moving season. It was an 80% jump over prior years. So there is a lot more supply even back 15 months or so on this chart.
You can see there’s just been a steady, unabating change. If you watch these data videos that I do, you know I try to figure out why that is the case. Is it a suffering to find buyers? The buyers are pulling back and all of a sudden there’s a lot of homes for sale or is it just buyers are steady, steady as they’ve been for a year and a half or is it sellers moving a whole lot of inventory in the market? Let’s check it ou
Buyer Activity and Pending Sales Trends
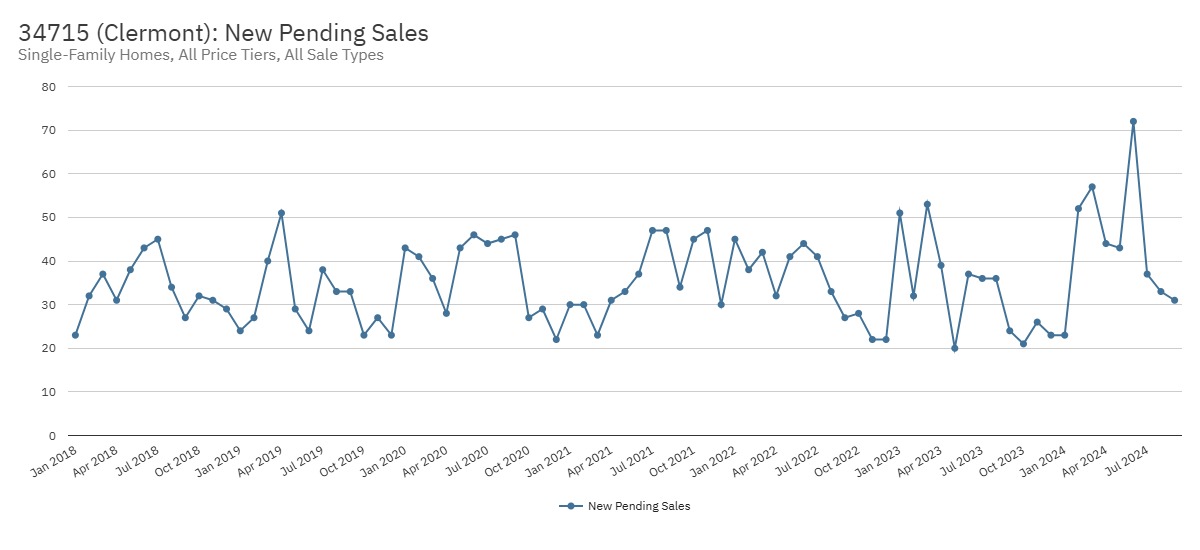
Now the next chart I wanna look at is called new pending sales. The reason I like new pending sales, we have two graphs for this. We actually have one called pending sales, which is just the static homes under contract. I don’t like that one because it’s a running total of just homes sitting under contract and that when there’s new construction, like Minneola has a lot of new construction. If I show you that chart, there’s this whole bunch of homes sitting under contract and you’re like, wow, that’s great. But that doesn’t mean you’re actually putting them down under contract every single month. This shows you the live feed, like how many homes are going to contract. Last month, there was nearly 30% more contracts than a year ago. Great sign.
This is again, this is unusually high for the rest of the market. You can see that in August, they were actually down 8% as they were trailing the prior year and then they were nearly flat in July, up 94% in June, up 115% in May. So Jared, what’s the verdict? Are the buyers quitting in Minneola? Not at all. This is actually very good buyer demand. And this again is most likely the fact that you’re having a consistent new supply chain. There’s a lot of growth in this area. A lot of people are coming to this area. They’re moving into Florida. This is a relocators haven right now, okay? So people are just coming to town. The schools are pretty good for the area. So not a lot not to like, and it’s not completely so popularized and priced completely to the moon that people largely can’t afford it. So you still have good buyer demand here.
Active Listings and Unsold Inventory
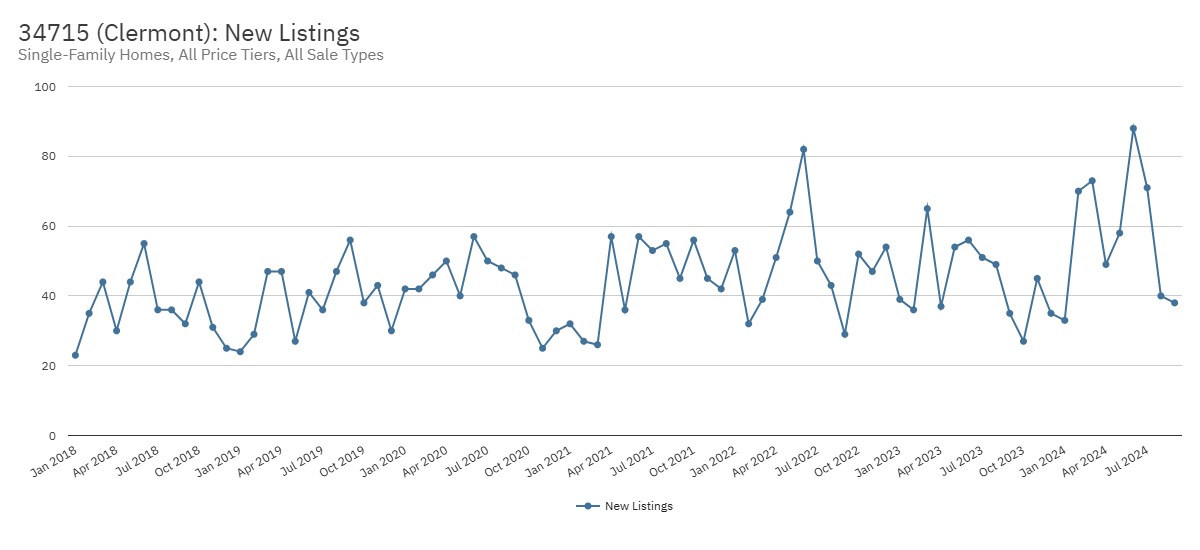
All right, the next chart I wanna show you is new listings. This is the rate of how many sellers have been bringing homes to the market. And you can see by just the visual on the chart that new listings have been well up this year.
Most months are 20 to 30% higher and that’s created the growing unsold inventory that we have just seen. So essentially, buyers have been pretty steady. They’ve been available, but you have just seen a consistent move of big numbers over prior year in terms of active inventory.
Buyer demand isn’t jumping enough to meet it. And so essentially you have a decent amount of unsold inventory in the market right now.
Closing Sales and Market Dynamics
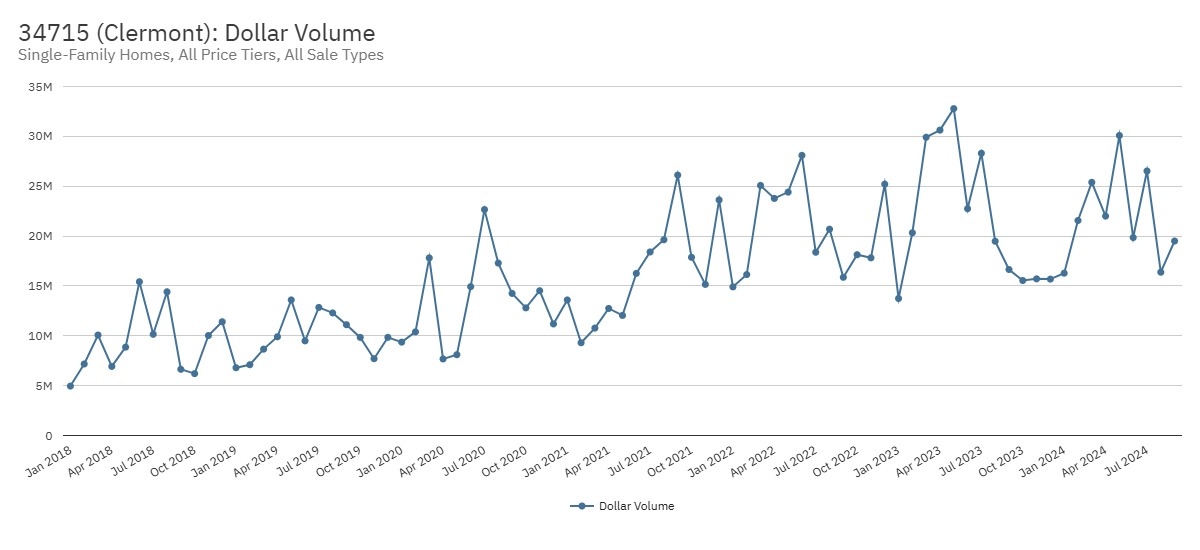
Now let’s take a look at dollar volume. This is a look at all the sales in Minneola as just imagine it’s an economy of its own. And just like GDP measures recession, if it’s negative to last year or if it’s above last year, which most markets in terms of just general real estate analytics, if you look month after month, marketplaces are usually positive or very close to even to last year month after month when you’re looking at the seasonality and how much they’re selling. But look at this. You’ve got an up month 17%, down 16% last month, down six three the month before that, down 12 before that, down eight before that, down 28. And ultimately, why is dollar volume down? Dollar volume is either down because you’re not selling enough homes or you’re selling homes at lower prices. Either way, this is a running string of negatives over the past year in the Minneola market. Interesting trend. So that’s gonna tell us what? Maybe those that are in the higher price points might struggle to get out of the market. Never know.
Best Realtor in Orlando, Florida - Reach Out Today
If you’re ready to make a move in Florida’s real estate market, don’t hesitate to reach out. Contact Jared Jones at 407-706-5000 (call or text) or email info@jaredjones.com for professional guidance and personalized service that will help you achieve your real estate goals.
Why Choose Jared Jones?
As a top real estate agent with nearly 4,000 homes sold and over 20 years of experience in the Florida real estate market, I have the expertise needed to help you navigate today’s evolving landscape. Whether you’re looking to buy or sell, my deep understanding of market trends and personalized approach will provide you with the insights and strategies required for success.
Stay Ahead of Florida Real Estate Trends
Unlock insider knowledge and stay informed about the latest in Florida’s real estate market! Subscribe to Jared Jones’ YouTube channel for in-depth analysis, current news, and expert insights on real estate trends across the state. Plus, check out my other channel for a deeper dive into the Orlando metro area, where I explore what it’s like to live in and around these vibrant neighborhoods. Whether you’re buying, selling, or just curious about Florida real estate, my videos will keep you ahead of the curve. Hit the subscribe button and stay updated with the most relevant real estate information!


