
Key Points:
• Orlando’s luxury home market, defined as single-family homes over $1 million, has doubled in active listings since 2020, primarily due to price increases that have brought middle-upper homes into the luxury category.
• Buyer demand is high, with a steady increase in pending sales for luxury homes. This market segment is less impacted by rising interest rates than lower-priced homes, showing resilience.
• Cash sales, traditionally a strong force in Orlando’s luxury market, have declined from nearly 50% in recent years to around 30% as economic factors slow cash transactions and high-priced feeder markets experience delays.
• Luxury home sales volume is up double-digits year-over-year, outperforming other Orlando market segments, where lower-priced homes face more volatility.
• Inventory for Orlando’s luxury homes stands at 6.7 months, compared to 3.8 months in the broader market, signaling a balanced yet active environment with ample options for buyers and a strong market for sellers.
Orlando Florida Luxury Real Estate Market Trends and Insights
For the first time on this channel, I’m going to do a data deep dive on what we will call the luxury home market in the Orlando metro area. That is all the single family homes that find themselves in the 1 million plus class. So if you’re a luxury homeowner now, possibly planning on selling your home, or you’re looking to buy a home in the luxury market in Orlando, you have come to the right place.
You’ll have everything you need to know to have your finger on the pulse of exactly what’s going on in the luxury market as we go into the winter of 2024 and even some predictors of what to expect in 2025. And I will make it my goal. If this video is well-received to continue to do updates along this line, specifically for the 1 million plus category.
And if that’s you and you find that helpful, drop down the comments below to help this video out. Plus to let me know that you found value from it. Let’s get started.
All right. The first time I show you is active inventory for the Orlando metropolitan statistical area. This is an area that’s carved out by the federal government.
They use this to do reports on different areas. They kind of bundle a few counties together, call it an MSA or a metropolitan statistical area. Our MSA really includes parts of Osceola County, Seminole County, Orange County, and South Lake County.
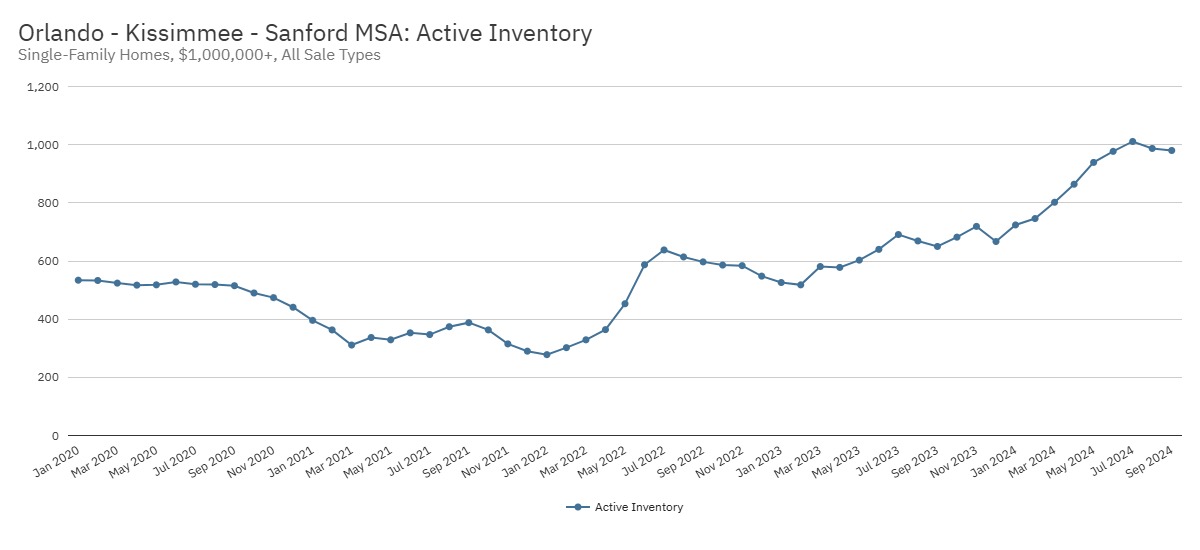
So as you can see here, January of the year 2020 represents kind of like the pre-pandemic era. I think it’s very important to kind of see how we went into this crazy chaos of a market. What was it just before that? And where are we now? You can see coming into 2020 that we really held around 500 homes in active unsold inventory in the plus $1 million single family market.
You can see that fell. The bottom of that was right around 300 units. But then as interest rates started to climb out of 2022, we had a big jump and it kind of got to about 630 units, which was kind of pre-pandemic norm.
Now I will tell you that that is anything but accurate. If you look at this from the, from the nature that the million dollar class of homes at this point looked very different than the million dollar class coming into the pandemic. These include what used to be kind of a middle class home.
So while this video is titled luxury, I don’t mean to offend anybody. If you have a $1.1 million home, you are probably closer to a middle, upper middle range property, what we call a move up category home. And that inventory has now drifted in many parts of our market, the higher appeal markets, like for instance, winter garden, where I’m at Oviedo Lake Nona, if you spend a million dollars there, you aren’t getting what was pre-pandemic consider luxury.
Don’t take any offense. I know your home is beautiful. That’s not my point here, but I’m telling you that when you are including at this point, okay, when you’re in 2022 and you have 600 homes available and that class includes a lot of winter gardens, former move up homes, you got to understand this is still a tight economy because the population necessary over on this side includes a lot of what used to be a six, $700,000 home or home buyer for it.
A lot of that is now up into the million plus. So this is a huge area of town, but not many homes listed in it. Okay.
So now understand where we are now. We just hit a new high in five years. Okay.
So we’re now about double where we were in 2020, which by all accounts prices in some of these areas might’ve doubled. So it isn’t necessarily that you have a huge percentage of doors listed still. Okay.
I know that’s probably confusing. Hopefully someone out there understands what I’m saying, but my premise is this. You have a lot more homes in the category, but the category itself includes a lot more inventory of properties.
The percentage of doors that would have fit in this category back here was tiny. It might’ve been less than 10%. Up here, it might be 35 or 40% of all the doors in Orlando.
If they were hitting the market, they would fit in this area. Okay. Get what I’m saying? The segment itself is a higher percentage.
So per capita, even though this is a higher number on a chart per capita, it’s probably not major, major high. So just understand that as you look at the data.
New Listings Surge as Orlando Luxury Home Sellers Rejoin the Market
Now, the next thing to see is probably not a shocker to anyone in the affluent side of the marketplace is that we’ve seen a healthier degree of transaction volume in the luxury market than we’ve seen it in the lower price ranges.
Okay. So if you follow Redfin, Zillow, a lot of people that are affluent that own homes in the real estate side, they’re watching market knowledge or market information. They’re seeing what CNBC is saying.
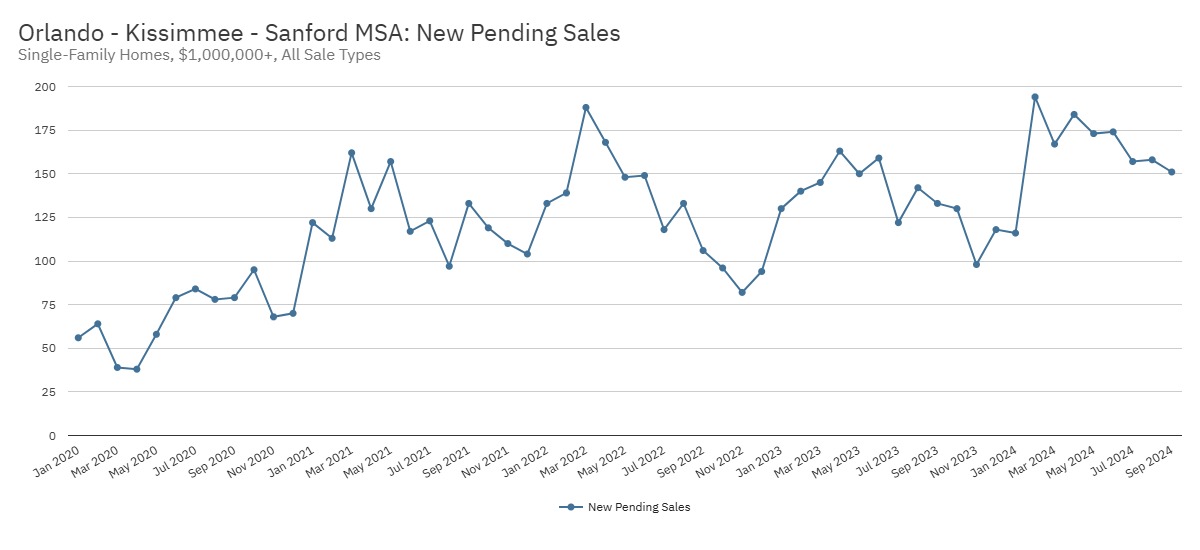
You’re seeing a lot of what has been reported as the luxury end of the market has been less impacted by some of the slowdowns in the marketplace. Whereas interest rates have had a huge damping effect on buyer affordability, not affecting the million plus. So the chart we’re looking at is how active buyers are.
New pending sales is a leading indicator to tell us what kind of homes we’re going to have sold two months from now. And you could see in the past six months, there hasn’t been a negative month yet. So every single month we’re now pending more homes than the year prior.
Now, mind you, this was the year prior. You can see every year there’s kind of like an up and a down motion into the year. It spikes to the middle and comes down.
You can see that this year, the highs were a little higher and the lows are still leading the prior year. And last year was anemic. Okay.
So you can see that in 2022, it was also a little bit higher until the back half of the year when interest rates themselves went from 3% 30 or fixed middle of 2022 shot well above 7% froze the market a little bit, but also sellers themselves became very inactive when that happened because sellers were also affected by the rate. So if I were going to sell my house and then I look online, I go, I’m going to get a 7% interest rate when I sell my house and get out of here. Or if I’m getting a jumbo loan on something bigger, then I’m going to be paying a lot for interest.
And they all of a sudden that froze the sellers up as well. So essentially what you’ve been having is the narrative of a frozen market. You could see it’s kind of becoming unfrozen, but let’s take a look at the listing side.
Are sellers this year meeting these buyers and pushing homes into the market?
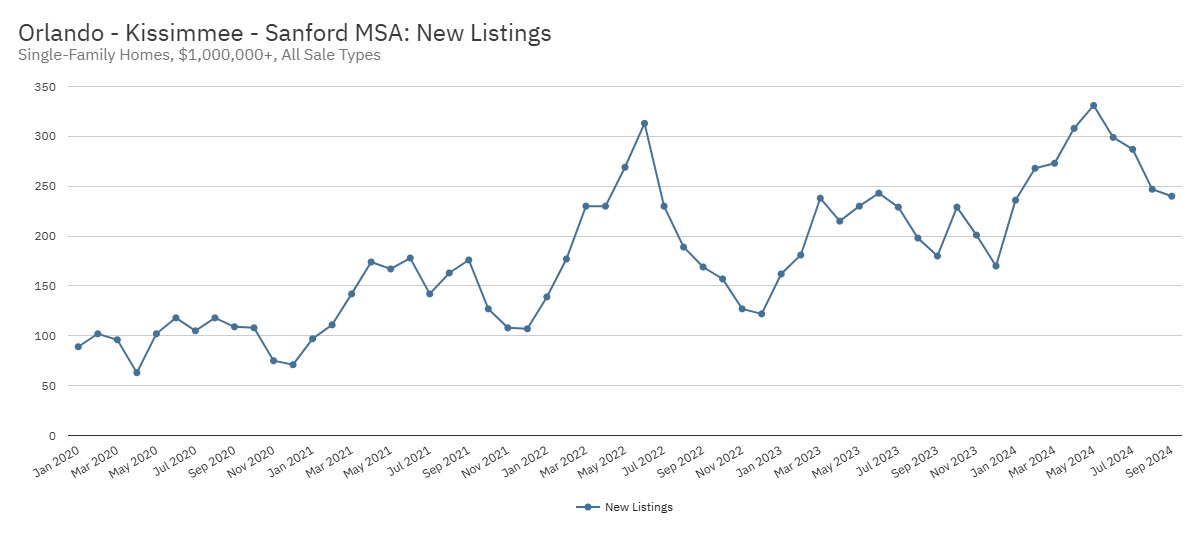
And the answer is yes, they are. In fact, this is one of the busiest years of new listings. You can see that if you look at the arc here last year, it’s very low, but we are definitely steep.
Like we were back in 2022, which was the end. This was the peak market. If you look at price on a graph, this was where price was the highest.
And every year since it’s been trying to track against the middle of 2022, but look at this year. Again, we had 33% more listings hit the market last month than a year prior. That’s a big jump.
24% below that 25% below that 23%. So for whatever reason, for whatever reason, back here in 2023, sellers felt froze. They want to sit back and wait and see they delayed their listing and putting their house in the market.
You’re seeing an improvement of the amount of sellers in 2024 saying it’s it. I’m putting my house in the market. It’s time.
So even as we’re going into a little bit of an off season, so September kids are already back to school. A lot of people with these busy families, these are not listing houses in September. We still see a nice increase over prior year in a downward slowing part of our typical season here in the market.
Hey, it’s me interrupting myself. You considering selling your home, make one call that’s all and put my nearly 23 years of experience and nearly 4,000 homes sold to work for you.
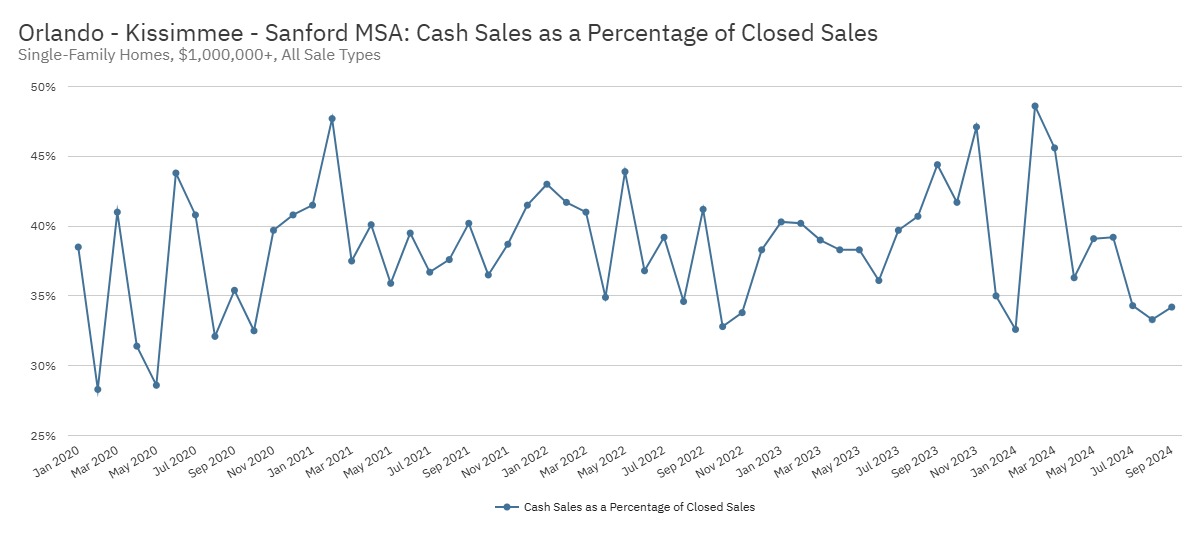
Now this is the percentage of closings in the luxury market from cash sales.
This is one of the few charts that you will see go extremely cold this year. Now this is a fascinating phenomenon. And I will say, as I mentioned, this is a fascinating phenomenon.
I’m watching all the markets. I have another channel where I do a lot of data on the rest of Florida where you’ll find me do updates on Miami, Tampa, Jacksonville, every single market come spring this year. So right around April, May, maybe as early as March, depending on the market, you saw any marketplace, the cash buyer percentage pool went very anemic.
This was also stark in Miami. So Miami has one of the lowest percentages of home closings with mortgages on them. They have a very low percentage of mortgage properties from anywhere in the state.
Impact of Rising Rates on Orlando’s Luxury Real Estate Sales and Inventory
You’ll find that in Miami, but even Miami has a massive fall off in cash buying this year. That has become an interesting part of this narrative because in a face of a marketplace with high interest rates, the cash buyers have been 30, 40% of the market some months, and they’re able to absorb and help keep the inventory moving. Even when the borrowing public is a bit frozen.
And we have an interesting narrative playing out because you’ll know everybody was planning for Jerome Powell and the pivot and the central bank to cut rates in his middle of September. We also remember that in the 45 days leading up to that cut in August, the 30 year mortgage rate already started to discount itself knowing that that upcoming rate cut was coming. In fact, I’m going to show you the chart right here.
This is August running down. It bottoms in September and it hangs out at six and a quarter for a minute. And then it spikes straight back up.
In fact, this is a move literally by October 2nd, right here, 6.26, where we are today. And the interest rate is nearly 1% higher for a buyer than 30 days ago. You see a lot of news about this being covered where it’s saying in the past 30 days, buyers have lost around $33,000 of buying power, whatever depends on the price range they’re in.
Some buyers are getting a massive cut in the pre-approval. So they went to the lender a month ago. And now all of a sudden, Hey, your interest rate is half a percent higher, three quarters of a percent higher.
You’re now shopping a hundred grand less. So ultimately the buying pool shrinks and that’s not good because look at what’s happening right now. 23% less buyers.
Now you have to understand, look at how much time the marketplace spends million plus around the 40% mark cash sales. Okay. So a lot of time is either above or below this line right here.
Okay. Depending on the time of year we are and all that kind of stuff. It got really volatile right here.
Went really low, really high coming into 2024, but then it’s sailed downward. So right now we’re just above 30%. We’re kind of running a trend there over the last 90 days.
And you might think, Hey, that’s not a big deal. We’ll understand the past couple of years, there’s been months where we’re close to 50%, particularly in this category. And I think this has a lot to do, obviously, when you’re talking in this price category with where money is coming from.
So a lot of Florida is fed on higher priced marketplaces. People sell their real estate somewhere else. They move it here for whatever reason.
This tells me that there is a challenge getting the equity from another market into this one. We are having the same narrative nationwide where other marketplaces around the country themselves are seeing the same issues where home sellers themselves are competing with more and more inventory around them. So it could be the delay and challenges that home buyers themselves are having just by selling an asset in Massachusetts or New York city or Connecticut for wherever they’re coming from.
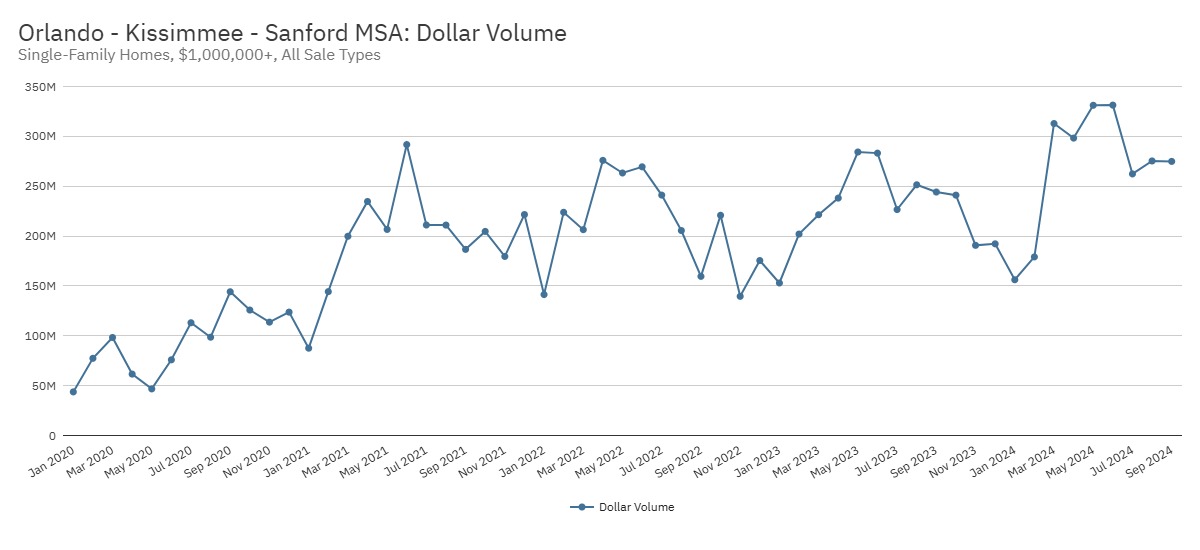
This is the dollar volumes. This is shows the entire index of million plus homes, how much is being sold in total sales. Okay.
This is important because obviously it shows no different than watching GDP. This is important to see the health of the market. And I will tell you, this is starkly different than the rest of the market segments in Orlando, where every single month in the million plus category this year, except for February, February was down 11.3% against prior year, but all the other months are up usually double digits, 16% over last year, 17%, 16%, 10%, 13%.
So you have a consistent running improvement in sales against prior year, which again, if I take you in a different marketplace and I pull all market segments up together, I would say very few of them, you will find six, seven months straight where they’re actually not seeing a fall off. I’m noticing in places like winter garden has a decent and growing size of the luxury market. They have been running negative for three out of the past four months in dollar volume.
This is interesting to me. You’re having a lot of that slide happening across the market as prices in some of these market segments are actually rolling a little bit backwards in order to get these homes sold. And in some cases you’re just not seeing enough homes to turn over to compete with prior year.
Is Orlando’s Luxury Market Balanced?
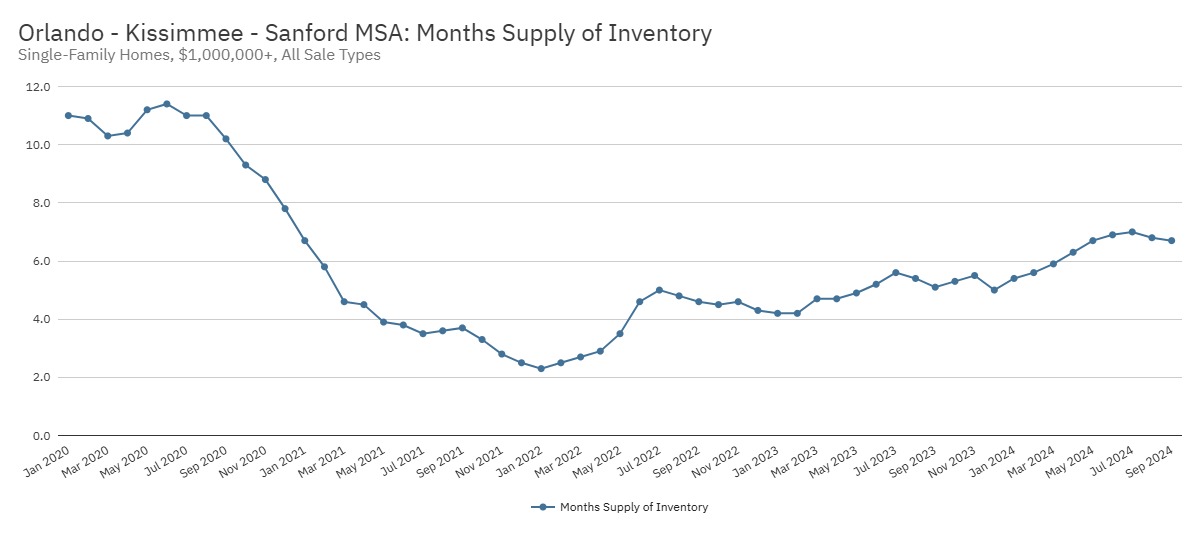
Months of supply is an important metric to show you how much energy, how much movement is happening in the market. The way you get months of supply is you take how many active unsold homes there are and how many we’re actually selling on a monthly basis. And if you stop listing homes in this category, how long would it take you to sell off all the homes? It’s measured in months.
So typically we would consider, Hey, if your housing market has three or four months of supply, it’s kind of historically normal. Now that isn’t necessarily the case in the luxury market. Obviously you have homes in this particular market, which can take a year to sell.
So looking at this category on its own is quite important. Now I will tell you as a point of comparison that all price categories in Orlando is running 3.8 months of supply. Right now it’s 6.7 months of supply.
That’s actually down in July because inventory member had peaked in July. Sales were quite down that month. You had a seven month supply.
Now this is the highest percentage we’ve seen in about four or five months over prior year. So right now we’re running 31.4% against prior year. It’s a little bit higher supply than history.
You can see that hovering around seven months is much different than when we came into the pandemic. When we were arriving in 2020 there was more than a 10 month supply. Now I will tell you, you have to understand the size of the market here versus back there is way different.
The size of the buying pool buying a million plus in Orlando and now is vastly two different places. If you’re in the central Florida area and you’re looking for a great church, I’d love for you to join me at the Grove Bible Chapel. Just visit joinmeathegrove.com for full details.
Best Realtor in Orlando, Florida - Reach Out Today
If you’re ready to make a move in Florida’s real estate market, don’t hesitate to reach out. Contact Jared Jones at 407-706-5000 (call or text) or email info@jaredjones.com for professional guidance and personalized service that will help you achieve your real estate goals.
Why Choose Jared Jones?
As a top real estate agent with nearly 4,000 homes sold and over 20 years of experience in the Florida real estate market, I have the expertise needed to help you navigate today’s evolving landscape. Whether you’re looking to buy or sell, my deep understanding of market trends and personalized approach will provide you with the insights and strategies required for success.
Stay Ahead of Florida Real Estate Trends
Unlock insider knowledge and stay informed about the latest in Florida’s real estate market! Subscribe to Jared Jones’ YouTube channel for in-depth analysis, current news, and expert insights on real estate trends across the state. Plus, check out my other channel for a deeper dive into the Orlando metro area, where I explore what it’s like to live in and around these vibrant neighborhoods. Whether you’re buying, selling, or just curious about Florida real estate, my videos will keep you ahead of the curve. Hit the subscribe button and stay updated with the most relevant real estate information!
Trustindex verifies that the original source of the review is Google. My wife and I purchased a home in Kissimmee, Florida and it was by far the best home buying experience we have ever had. This is our 7th home we have purchased. Stephany Cornelius was our Realtor from Jared Jones Real Estate Team and we couldn't have been more pleased. She made the process so easy, less stressful and guided us through every aspect including a very quick closing. I highly recommend Stephany if you're trying to navigate the home buying experience here in Florida.Posted on GoogleTrustindex verifies that the original source of the review is Google. Jared Jones was amazing at helping us pick and getting our dream home. He was very patient and always had an answer to any questions we had. Could not be more thankful for him and his team.Posted on GoogleTrustindex verifies that the original source of the review is Google. Jared and his team were great to work with. Always professional and responsive to every situation that arose. Would love to work with them again on future deals.Posted on GoogleTrustindex verifies that the original source of the review is Google. Jared and Kristen were a pleasure to deal with. Their professionalism and quick responses made the entire closing process smooth and stress-free. I look forward to working with them again on future transactionsPosted on GoogleTrustindex verifies that the original source of the review is Google. Jared was great! We were moving to FL from out of state and he made everything so much easier!Posted on GoogleTrustindex verifies that the original source of the review is Google. Jared was absolutely amazing to work with. I came across his content on YouTube and from the very first time we spoke I knew I wanted to have him handle this process for me. Many realtors try to simply sell you a property and then move on……..not Jared. Jared is numbers driven which to me was extremely important. He guided us into specific areas that we wanted to be and gave us the data to justify our decision making in tandem with his recommendations. He has a unique ability to guide buyers that I really haven’t seen before and for that I’ll always be grateful. He also recommended things outside his scope based on his experience of closing on over 4000 homes which came in handy as we are out of towners. Those things matter most for buyers and Jared ticks all the boxes. Lastly the one thing he said to me that always stood out was that when you purchase a home with him……he comes with the home. That personal competent touch is what makes all the difference. Close your eyes, take his guidance and let him handle everything. Will definitely recommendPosted on GoogleTrustindex verifies that the original source of the review is Google. Best decision we made was to hire Jared to sell our house. We were in awe of the level of professionalism in every aspect from the advertising of the house all the way to closing. Jared was approachable and responded quickly. His team was on top of every detail after the house went on contract. Throughout the entire process we were updated as to what was happening and received clear and accurate answers to all of our questions. Highly recommended for selling or buying because of his knowledge and work ethic.Posted on GoogleTrustindex verifies that the original source of the review is Google. We used Jared Jones to help us relocate to the Orlando area, and we couldn't be happier. Jared is incredibly knowledgeable about the market and provided deep insights during the inspection and negotiation phases, which gave us so much confidence in our decisions. His team also has a very streamlined process for managing closing timelines and tasks with total precision. As out-of-state buyers, having everything handled with such high efficiency was huge for us and made the entire home-buying process a stress-free experience.Posted on GoogleTrustindex verifies that the original source of the review is Google. Jared Jones is a great Realtor. I originally found Jared through his YouTube channel, where he gives incredibly helpful information about Orlando. I can confidently say he is just as good of an agent as he is at providing great info in his videos. We recently relocated from out of state, and he helped us purchase our new home here. His team made the entire process smooth.Posted on GoogleTrustindex verifies that the original source of the review is Google. Jared was a pleasure to work with as we relocated from Virginia Beach to Orlando. I’m a retired Naval Aviator. I have high standards for performance and Jared exceeded every one of those standards. He is wealth of information. He and his team are organized, responsive and effective. His property searches were particularly noteworthy - they were tailored to our specific requirements and produced really great, applicable and attractive results, in stark contrast with many “realty” services that simply hit a price range and have wasted my time with extraneous, undesirable results. His support before, during and after the sale was simply exemplary. His sales (purchase) negotiation on our behalf was fair and effective. His advice throughout was clear, thoughtful and measured. He spoke with the voice of experience. His organization, knowledge, effectiveness and customer support compel my highest possible recommendation. There is no finer Agent in the area. He is the best.Verified by TrustindexTrustindex verified badge is the Universal Symbol of Trust. Only the greatest companies can get the verified badge who has a review score above 4.5, based on customer reviews over the past 12 months. Read more
Jared Jones Real Estate Team Serving All of Central Florida
- Osceola County
- Orange County
- Lake County
- Polk County
- Seminole County
- Volusia County
- Broward County
- Marion County
- Flagler County
- Brevard County
- Pinellas County
- Hillsborough County