They’re still very hesitant, you know, very distant from the market yet more sellers are putting their homes on the markets. Now you went from a two month supply to a 3.6 month supply, which is significant. And that’s what precipitates price reductions.
There’s definitely a level of increased competition fell across the marketplace. All right. Now let’s take a snapshot at Windermere.
I’m even stay with me. As soon as I’m done with this, I’m actually going to pull up a few charts, really kind of show you how this particular market is changing in real time. Take a look at the closed sales.
Remember Orlando wide was only down 3%. Windermere is down 26% in closed sales year over year cash sales in Windermere down 21% cash as a percentage of closed sales is actually showing as an increase. Interesting here.
Look at this median sale price in Windermere folks is down 8.9%. Again, that’s a one month trend. We take a greater look at that in a second. By the way, Windermere has crazy jumpy data.
So one of the things I will tell you is this particular marketplace, because of the nature of being luxury, you see the average price here where it shows it’s negative 17% in average price. You know, realtors might show you that and be like, Oh, this is crazy. It’s down 17%.
Average price is very much a function of how big the properties were that sold. So you might have your closings down like you do in Windermere, but they could all be luxury and they probably were. And ultimately, or maybe they weren’t, maybe there were smaller purchases, which creates a downward sag on average price.
So understand median price is going to be a much more real indicator. That’s just the median. It cuts right to the middle.
It’s less influence at any given time by the low end or the high end. And that is going to show you that right now there’s definitely some price softness going on. Check this out. This is incredible folks. Dollar volume. Okay. Total number of closed sales was 86 million last year. Okay. And here’s the thing.
Last year was not a big number folks. And we’re way down. I mean, Windermere realtors are bored and I sell some homes in Windermere like the rest of the agents in this market, but it is definitely seeing a lot less transaction volume at the moment.
In a second, we’re going to pull some more data to show you exactly why that is. Sellers in Windermere are still getting around 97% of their original asking price. They’re negotiating a little bit, but that’s really kind of unchanged.
It’s taken about 70% longer this year to sell a house here. New pending sales are dead even till last year, which that’s not a bad sign. Whenever you see that the new listings are up 6%.
So you have more homes hit the market than year prior and pendings were even inventory is up about 3.4%. But look at this. Obviously you have 76.7%. So just like you saw the Orlando trend was up in the 70% range. If memory serves, you can see the inventory again in Windermere is also stacking up.
Look at the months of supply. Months of supply went from two months to four months is a straight up movement in that chart. Now let’s dive in a little bit closer and show you more detail of what’s going on here. All right, folks, let me show you what you’re looking at here. This is active inventory, and this is the history for Windermere. This is going back left side of the chart where you see my cursor over here.
This is January of 2012. This shows you that really going into the pandemic area, that somewhere around 340, 350 homes on the market at any one given time was kind of the norm. You can see that Windermere shot all the way down to about 50, 60 homes on the market as obviously there was a constrained supply because of COVID and everybody just buying up as much as they could with low interest rates.
You can see that right here, see this big leap mid 2022. This is when the fed starts raising interest rates rates go from like a 30 year fixed at 3% to like 7% overnight in the fall of 2022 and Windermere took some inventory. So it went from 65 homes on the market, three, four months later, there are 176 homes on the market and you can see that some time after like the fall, it just stabilized. It shot straight up to that number, stabilized all the way to the end of the year, and then even started to drop. And my friends, this is unusual for the Orlando market.
If I pulled you the Orlando market, they have been in a continuous upward trend. If this was the same chart, you would see the rest of Orlando somewhere up here. Okay. But as you can see, yes, this is interesting right here because right now inventory is at highest levels that you’ve seen in this area going back to December 2020. So like early era pandemic is where it’s going. It’s still not near where it used to be.
So it, and that’s necessary in the market that we’re in. When you have a harder time with buyers wanting to pay the prices that we have in the market. Now, this is a good thing that you don’t have such high inventory.
So I would tell you across inventory, Windermere is a little bit tighter, but with this trend, you can see that December of 2023, there were 138 homes on the market. As of right now, there’s about 212. So it has been steadily climbing over the past six months.
Look at the chart down below. January, 2024 was up 26% over prior year by March. It was up 48% April Pete.
It’s 83% year over year. And folks, all that is, is more people listing buyers backing away and say, I’m not buying, but this is a steady climb. This will be something to watch because as of recent, the last three or four months, we broke through the previous plateau in Windermere, which Windermere homeowners are going to feel a little bit more.
Like there’s a little bit more in the market than there has been in about two years time. And again, look, they are used to carrying 350, 400 homes when you’re just over 200. That’s nothing to be too concerned about.
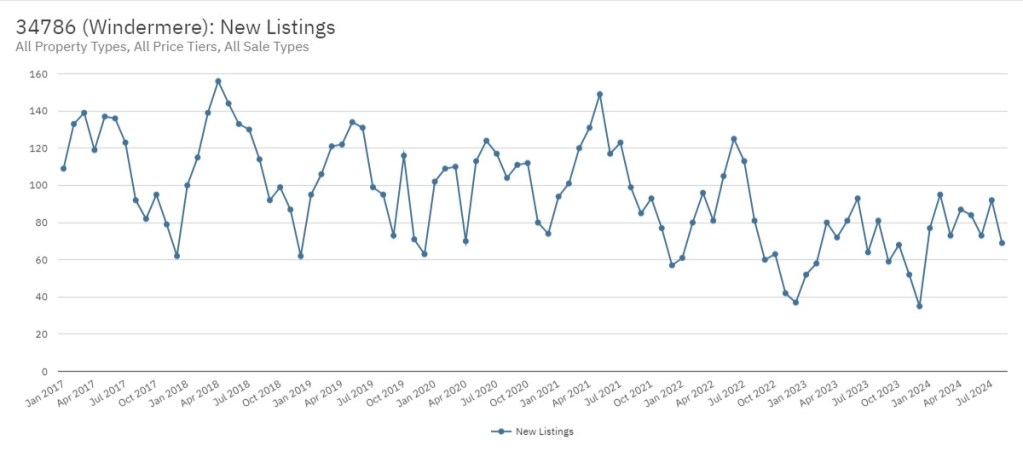
However, 300, 300 plus with a, with a lack of buyers will probably feel different. And it’ll probably set some longer timeframes to try and sell a house taking a look at this. You’re looking at new listings on the market.
I really want to call your attention to down here in January, 48% more listings hit the market than the year prior and February 64% more than in March. Everybody got the message and said, Hey, you know what? We should back off and stop listing so many homes. And then in April, it’s back up 21%.
For whatever reason, in 2023, when we had very low inventory and it seems it’s changing, it seems that whatever has caused people in Windermere to lock in and kind of collectively as a group say, I’m not putting my house out there. It seems like that levy has snapped a little. It’ll be interesting to watch this over time and here lies the problem. What you’re looking at right here is pending inventory. Remember how we were looking back at 15, 16, 17, 18, getting an idea of a pre pandemic health for the market.
If you kind of cut a line through here, Windermere is used to carrying 132 homes in pending status at any one given time. Now, look at this. If you carry 132 over to the right side of the screen, that line is somewhere right here.
Look how long it’s been since this kind of inventory has been in play. So, you know, the interesting thing will be to see is again, the buyers are away. I mean, people don’t like to say it.
You know, everybody’s confused about the idea that buyers, they have really felt some shock and, you know, there’s not as many of them in the market. And again, like I told you, if inventory stays low, that’s not a problem. But as we see things shifting, we got to keep our eye on it.
We’ll see how this plays out in a 2025. Now, last shot I want to show you is one of my favorite metrics in economics called months supply. This is if you looked at housing inventory based on how slow the market is buying the pace of new listings.
So inventory in Windermere is above the Orlando norm. Remember we saw Orlando was about 3.2 or 3.6 months of supply.
Windermere is at a four month supply. If you stop listing homes and just sell off what you’ve got based on how slowly the buyers are going, it’s a four month supply. Now in history, look at this.
If you go back 2018, you know, we’ll say 17, 18, 19, Windermere is used to four to 4.4 months of supply. Okay. This is where it lives.
So as we approach, the inventory gets a little higher. If buyers are still not buying this months of supply, you can see is going vertical. And if it keeps going up, the higher this gets over history, that’s when you see sellers get antsy, price instructions happen more and that’s when you actually have effect on prices. The higher months of supply, months supply is the most amazing factor to watch because if that gets out of hand, that’s when you really start to see things shift and you can understand it’s a buyer’s market. So right now, because it’s still just getting to the level of where it’s been, you know, this is just approaching, I’d say this is still a tad still on the seller control side.
This is getting closer to where you consider it more into a balanced market. If it keeps going above where it is and start hitting four, three, four, four, and it’s jumping right now. I mean, there’s no reason to believe this could have changed.
Look at this December of 2023. It was a 2.4 month of supply by January is two eight by April. It’s 3.7. So, I mean, this has made some very big strides, um, recently.
So, I mean, at the current pace, it could be at five months of supply in like four or five more months. Once you get above five, it would be interesting to see what happens. Hey, if you’ve watched this far, do me a huge favor, drop down below in the comments and tell me what you’re seeing in your neighborhood.
Where are you from? And what are you seeing in your marketplace? And second, let me know what marketplace you’d like an update on. I’m doing nearly daily updates on this channel throughout the Orlando metro area. So if that’s the kind of content you love, make sure you smash the subscribe button, hit the bell icon, make sure you don’t miss any updates.
Also, if you’re interested in real estate topics across the entire Florida market, make sure you go check out my other channel. I’m going to leave that link in the description below on that channel. We cover all things, Florida real estate, what’s going on in the insurance market, what’s going on with HOAs and HOA litigation, and what’s going on on national level real estate and economics.
We cover all that there. Please consider subscribing to both channels. And if you’re buying or selling anywhere in Orlando, unlike the e-harmony of real estate, I have buyers calling and I pair them up with sellers to make sure your dreams in real estate can become a reality.