Key Points:
-
• St. Cloud, Florida, offers affordable new construction homes with significant price reductions, some discounted by over $100,000, providing valuable options in a shifting housing market.
-
• Housing inventory has increased to 91 homes, the highest since 2018, with a current supply of 3.6 months, indicating more options for buyers and heightened competition for sellers.
-
• Recent data shows the median sale price at $345,000 in August 2024, a 5% year-over-year decrease, driven by more listings and reduced buyer demand.
-
• August saw 41 new listings, a 37% increase from last year, with higher listings even in slower months, as sellers aim to move properties despite lower demand.
-
• New construction homes with competitive prices and favorable mortgage rates are adding pressure on traditional sellers, who now need to lower prices or add incentives to attract buyers in this market.
St. Cloud, Florida: Affordable New Construction Homes Amidst a Shifting Housing Market
I’m often asked what is one of the best places that you can live and still yet afford a new construction home, and I’m always brought back to my old hometown, St. Cloud, Florida. Now, it’s no secret that St. Cloud is one of the fastest growing cities in central Florida, and most people appreciate and move to the area because it’s near Orlando. It’s 25, 30 minute drive to downtown.
It has a little bit more of a small town feel. And yes, I will admit, if you visited lately, you can clearly see that this small town is growing fast. And with that, you have those infrastructure challenges.
The transportation, the roadways, the services that the locals look for are all under stress because there’s a lot of people coming to this area. But there are also changes unfolding in the housing market in the St. Cloud, Florida market. So if you presently own a home in St. Cloud or you own an investment property, you’re considering moving to the area, you’re going to want to stay tuned because I’m going to do a deep dive in the day to show you exactly what’s going on.
We’re going to walk through a couple of properties that I saw that have 50 to more than $100,000 price cuts on some beautiful custom homes. So without further ado, as we dive into the update, drop down below, smash the thumbs up as a huge thank you if you appreciate all the research, time, energy it took to go into this video. And I thank you for that.
Let’s get into it. First chart, I’m going to show you all the charts. In fact, we’re going to go back to January of 2016 and go all the way to present day.
Now, this is the first chart I’m going to show you months of supply. This is one of my favorite economic indicators, show you the true health of an economy in one snapshot. This is really how much activity there is, transaction volume and months of supply is measured like this.
If you were to stop listing all homes in St. Cloud, how long would it take you to sell through all the inventory that you have? Now, right now, it currently stands on the far right edge of the graph at 3.6 months of supply. That means understanding this, there’s more homes being listed every single day. But if you could just stop that flow based on how fast you’re absorbing them, this would take nearly four months to sell off.
Now, as I look at this, 3.6 months is not crazy high. Okay. So if you consider, you know, the entire national economy, most of the marketplace is somewhere around 3.5, 3.6, something like that.
But look at the history in St. Cloud, going back to 2016, it has never been above a three month supply. Okay. Now is that the end of the world? No, but I will tell you this over the past four or five months where this is now elevated over three, because this is recent history, folks, this summer, we came through moving season and three, four, seven, six, nine shifted.
And when it does, and you have a higher month of supply, that means sellers are facing a sense that there’s more competition. There’s more competitiveness, more of the neighbors are for sale. And at the same time for this to also be created, there is a pulling back of the buyers.
Buyers are shifting away. Look at this. It was a three month supply a month prior.
It went from three to three, six and a single month. So again, it just shows you as a combination of listings, hitting the market buyers, backing away from the The higher this goes, the more chance that you’re going to see a precipitation of price softness. All right, next chart, active inventory.
You can take a look. It’s at 91 homes on the market. Look at this.
The last time there were 91 homes or more on the market, September of 2018 is about six years high level of inventory. And again, you can see through moving season. Usually we see a little bit of a slowing down.
You like, look at last year or 22. This is 2022 going into 23. Look what happened in moving season of 23, January, February, March, it was a sell off.
Okay. So usually we see an energy in the market absorbing inventory from February, March, April, May and June. Look what happened here.
This all went north. So we’re going to see exactly why that is as we unfold this narrative in three, four, seven, six, nine. Is this a story of a lot of sellers pushing inventory of the market? Or is it a story where your sell-off is low? Buyers are not engaging.
Your pendings are way down because buyers aren’t putting anything under contract. What is the story behind this shift? Because it is shifting. We can see it loudly and clearly here in the data.
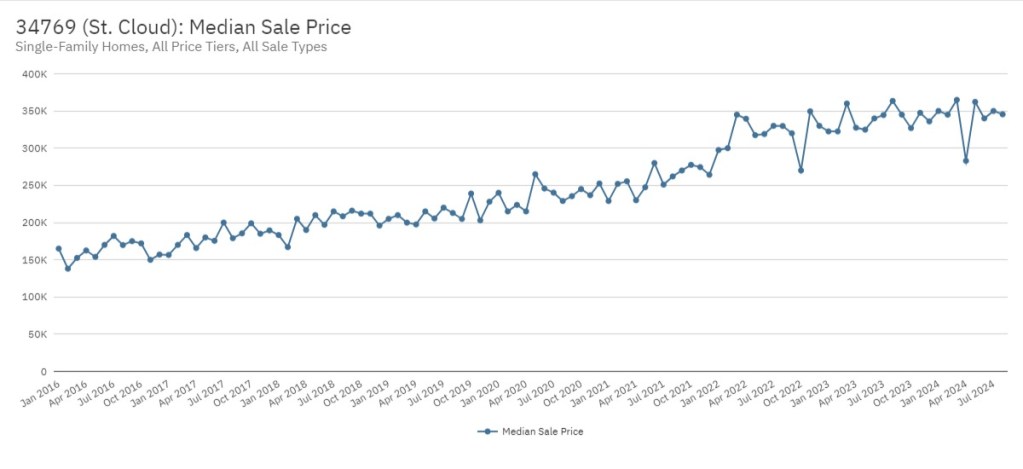
Now look at the recent data on median sale price. Okay. So we obviously know there’s a shifting in the market.
What’s going on with price. We’ll take a look at this in August of 2024. This is the most recent data.
And by the way, all of this is directly from the backend of the realtors board. Okay. So you have to have a real estate license to log in and access this data because this is, we get this from the entire state, but take a look at this 345,000 last month represents a 5% negative.
Okay. So down the middle and again, median sale price is one of the most accurate ways. My favorites better than average sale price, because average sale price can be skewed.
If a given month goes by and you sell a bunch of little homes or a month goes by, you sell a bunch of high-end homes with this. You’re measuring the sale price down the middle, each and every time. It’s one of the more safer ways to get a pulse on the market.
Now you can tell that this was months in the making, because if you look at July, it was barely above positive. So we had a 5% loss this most recent month. You had one six last month.
You had a flat zero. You were up 11 in May and you were down 13% in April. So you can see for all intents and purpose, however you want to look at it.
If you pull back on this, you’re trending downward. Okay. So if you string all these dots together, the price is gradually in a softening pattern.
Okay. It’s not free fall or anything like that, but you can see the wind is at the buyer’s backs right now in this particular zip code. All right, now onto new listings.
Are we seeing an elevated number of listings being put in the market here in 3, 4, 7, 6, 9? Here’s the story, because one thing we’re noticing is there’s a lot of active inventory. We saw that a second ago. There’s 91 homes in the market.
Where are they coming from? Something I want you to see is that all of these months were around 40 units for the last couple months, 41, 39, 36, several months of this year, 35 to 40 plus units. If you look at last year, several months of last year, they never even got above 30 new listings in a single month. So look, look through 2023.
The 2023 spent a ton of time below this line right here, which is 30 years. Yeah. Three months where you actually saw an elevated above 45.
So here you have 37, 38, pushing 40 units or plus 40 for a lot of the most recent six, seven, eight months. So look down here. So August was up.
It had 41 listings that represented a 37% increase over a year ago. Okay. That’s a seasonally weird move for you to have a lot of inventory hitting the market in August.
Now, why is that? Okay. Usually there’s back to school. There’s, I mean, a lot of people are not putting themselves in the market in that month.
It’s just a little bit seasonally slower, but look at July, July was down, but there were a surplus of listings in June. It was down in May. There was a 33% surplus.
Again, you have a, you have two months where you’re a third higher than, than prior year, same month, uh, up 19% in March up 28% in February and up 13%. So for whatever reason, I think this story can be told in a lot of other markets around the Orlando Metro. There’s a lot more sellers pushing their house in the market.
We don’t know the reasons there’s, you know, for whatever reason you see the story in 2024, that there was a, uh, that, that this year for whatever reason, we’re kind of coming back to normal and that sellers are bringing their houses to the market. Last year you look and you see a lot of this where it was like slow 23, much busier 24. Now all that’s fine.
It’s all, it’s all fine. If you start to, to, to see listings kind of resurging back to what they were pre pandemic, as long as there’s buyers buying them, as long as you have good pending volume. So let’s take a look at that.
All right, take a look at new We had 22 homes go under contract and this is the problem. So a month like last month, we just saw 41 homes hit the market in a single month on top of a bunch of listings that are already there. 60, 70 listings.
Well, you only pended 22 properties, but you added 41. So if you have a lot of months like that, where you’re only selling off a fraction of the new stuff, knowing that you’ve already got three to four months of housing sitting there, many of them trying to get out of the gates and get sold so they can move on. And you can see, look at the chart.
Look how much of history going back to 2016. Look how much time you see 36 to 50 homes pended any given month. Now look at the most recent year and a half.
This is the problem with 23 and 24, particularly in Orlando area. Look how much from this whole bit of history to here, look what happens. It just fell going into 2022.
By the time you start 23, you never had a time where you even crossed this line of 40. So, and that becomes a challenge for a marketplace. When you start seeing a seller’s pushing through this 40 unit per month, they’re listing that many homes, but yet you got all this sustained time where these homes are just staying below the market.

St. Cloud, Florida Real Estate: Price Cuts and New Construction Opportunities in a Competitive Market
Now we’ll tell you that some of this is due to new construction competition. You can go and buy three and four bedroom, new construction townhouse, and a single family starting in the threes. That’s where it starts.
This market starts in the same cloud. Now those particular sellers are selling a brand new house. They’re then selling it with a four and a half or 4.9 interest rate.
Okay. So then these sellers start to have to do business against those kinds of home sellers in these growing marketplaces. Now closed sales were elevated last month.
You had 30 units sold. That is again, that’s over last year by 7%, which means a couple months back. Remember if you got a closing right now and this particular month, these went under contract 45 days ago.
So, you know, a couple months back you had decent volume and ultimately that created closing volume that you need. But look at the history going through moving season. You had months where you’re closing 27, 25, 28, 25, 30 units.
And again, look at history. History for this marketplace is mostly 30 plus to 40 units throughout the year. You had sustained amount of time where you did have a couple months where you’d fall off in low season, but essentially most of the marketplace is positive.
And again, you have the volume down and this is just, you know, this takes his toll on a market whenever you have your pendings down that precipitates to your closings being down. And ultimately you’re going to have higher active inventory and in all likelihood sellers becoming a little bit more negotiable in time. Now the next chart, let’s look at the new median list price.
Median list price is an indicator to tell you whether or not you have a risk of your median sell price falling and continuing to drop. Okay. Our price is at risk.
If you start your inventory at prices below a year ago, then you’re going to sell your homes below a year ago. Now look at this, this is a chart going back to 2017. This line down the middle is a zero line.
That means month after month after month, all of these, there’s little dots. You can’t see them, but you can see that over the time of about seven years on this chart, there’s only a couple dots that actually fall below zero line. 95% of the time homes at three, four, seven, six, nine are listed at prices ahead of last year.
That’s why this chart is important. But look what’s happening here since may all the listing volume coming to the market are asking prices negative to last year. And it went all the way up to about 8%.
So you’ve had about five months now. And again, it looks like this most recent month sellers are tightening up on the price a little bit at negative 3%. But keep in mind, even these sellers that are listing a bulk of inventory this month, 35 homes coming to the market at negative three to a year ago, they’re also going to give back another 3% most likely when they negotiate, maybe more, maybe they do a couple price reductions.
The point is when you see this consistently below zero, that is a forward leading indicator to tell us that there’s most likely to be price softness in this area going forward. Something to keep in mind. If you’re a seller, that means that sellers in your market are looking around doing their research and they’re having to bring the price down in their minds to have a successful sale with everything going on.
You may be thinking of buying, selling, or investing in real estate, no matter where you are in the country. My team can help call or text us at 7 0 6 5,000. That’s 4 0 7 7 0 6 5 0 0 0. Shoot us an email at info at jaredjones.com. That’s I N F O at jaredjones.com or visit jaredjones.com. Let’s get back to the video.
Now, let me show you a couple examples of what is going on with price cuts in this particular market. This property is $600,000 asking price. This was built in 2009.
It’s on a one third acre lot. It’s a four bedroom, four bath, 3,700 square foot home. Really nice.
I classify this as almost like a semi custom. It’s just a nice touch. You know, it’s got some really cool aesthetics on the exterior.
It’s got a barrel towel roof, which, you know, that might be common in Miami, but we don’t have that too much here. Nice wide three car garage with pavers. You can see the interior touches a little bit nicer.
You got wood flooring, coffered style ceiling. And again, there’s no swimming pool, but it’s got a really nice size yard where you could add one fully screened in line in the back. And it’s got no neighbor really off to the front because there’s a pond on the opposite side.
So you kind of have the water view out the front and pretty private rear yard. Now this property is $600,000 asking price. They started this property in January of this year at $850,000.
They’ve reduced this property by over $200,000 and still it remains unsold. Here’s another property, much like the last one, it’s been reduced by like 15%. This property hit the market in February for $840,000.
This is a $675,000 asking price, nearly 3,000 square feet. Now this is a brand new house. This is a four bedroom, three bath in the estates section of Harmony.
If I show you this overview, this is a beautiful lot. Again, close to half of an acre. It looks like it has a pond view here in the back, some partial golf course views here off the back towards the right.
And it’s a beautiful setup. The interior is gorgeous. You can see some of the photos here.
It’s got just a nice open living area, beautiful, modern looking kitchen, gray cabinets. You can see some of the features like this little drop zone, which I believe is probably near the garage, the laundry. You have all the cabinets already built in, which is just a nice plus.
You can see here that it’s a two car garage, but it’s like a two plus, like there’s so much storage on the outside of where the door is. Once again, pretty good offer down to $675,000. Again, been on the market since February.
They’ve been slashing that price ever since. All right, the last property I’m going to show you is a four bedroom, four bath, 3,084 square foot home. It absolutely shows like a model.
You can kind of see from the interior, look at this, kind of did some architectural design, beautiful backsplash, plused up these under mount sinks, the gold faucet, gold hardware on the cabinets, just a nice touch on this particular property. Look at that, even the microwave, gold handles, look at that living area. You got the water view out the back.
It’s a really nice house. Look at the bathrooms. They match that modern look with these beautiful, they got gold everywhere, gold hardware on everything.
And I have to believe they probably redesigned this when they purchased it, but this asking price, they started four months ago, folks at $689,000. This price is down 90,000 from the start, just a little over five months after they started this process. As always, if you’re thinking of buying or selling in the St. Cloud area, make sure you put my team and I’s 20 plus years, nearly 4,000 satisfied home sales to work for you.
Also, if you’re looking for a great church to worship one Sunday in central Florida area, consider joining me at I’ll drop a link below. I’d be honored for you to be my guest one Sunday. And if you’ve watched this far, do me a huge favor.
Best Realtor in Saint Cloud Florida - Reach Out Today
If you’re ready to make a move in Florida’s real estate market, don’t hesitate to reach out. Contact Jared Jones at 407-706-5000 (call or text) or email info@jaredjones.com for professional guidance and personalized service that will help you achieve your real estate goals.
Why Choose Jared Jones?
As a top real estate agent with nearly 4,000 homes sold and over 20 years of experience in the Florida real estate market, I have the expertise needed to help you navigate today’s evolving landscape. Whether you’re looking to buy or sell, my deep understanding of market trends and personalized approach will provide you with the insights and strategies required for success.
Stay Ahead of Florida Real Estate Trends
Unlock insider knowledge and stay informed about the latest in Florida’s real estate market! Subscribe to Jared Jones’ YouTube channel for in-depth analysis, current news, and expert insights on real estate trends across the state. Plus, check out my other channel for a deeper dive into the Orlando metro area, where I explore what it’s like to live in and around these vibrant neighborhoods. Whether you’re buying, selling, or just curious about Florida real estate, my videos will keep you ahead of the curve. Hit the subscribe button and stay updated with the most relevant real estate information!
Search Homes in Saint Cloud, Florida
No Results Found.
Jared Jones Real Estate Team Serving All of Central Florida
- Osceola County
- Orange County
- Lake County
- Polk County
- Seminole County
- Volusia County
- Broward County
- Marion County
- Flagler County
- Brevard County
- Pinellas County
- Hillsborough County