Volusia County Real Estate Market Update: Trends, Challenges, and Opportunities in 2024
A lot of folks just want to hear about the data. They just want an update. They want to know how is this county doing? How is the zip code that I’m in? And a lot of times I will start the narrative for the area that I’m talking about with some macroeconomic data or some updates on what’s going on in the greater economy because those things affect where you live and I got to tell you folks, there’s some interesting things breaking out. And today we’re going to focus on an area north of the Orlando Metro. Some of the areas on the south side of the county of Volusia, which is what we’re talking about today, are actually very much a part of the Orlando Metro area.
Specifically when you’re talking about Deltona and Deland and many of you Orlanders, you’d say, you know what? We don’t claim you Volusia County people. You are not a part of the greater Fort county area, which makes up Orlando. We do not count you as us.
But I have to tell you through the exploding home prices over the past five years, many people who work in Longwood, North Orlando, Lake Mary, Heathrow, many of those locations becoming far too expensive, pushed people to then take the 20 minute drive just north to where they find themselves in South Volusia and Volusia County. My friends, I get more requests for updates as of late, people just beating down my door in any way possible saying, Jared, you got to tell us what’s going on. So back to the point I’m making as I opened this video, what is leading headlines today? Well, there’s a lot of corporations that are struggling.
In just the past week, Disney CFO just came out and said, surprise, we’re starting to see that park attendance through summer is starting to look bad. We’re going to have some weak numbers in the third quarter. Fast forward to last week, then all of a sudden we saw Airbnb’s stock absolutely crumble.
Might I add completely unconnected to the Disney point I’m making, but some ways they are connected. Now Airbnb is having a problem because they’re showing that there are signs of weakness in their earnings. They’re saying that people just can’t afford the luxury of renting our places and that demand for Airbnb all across the U.S. is cratering and so their stock plummeted.
Now, if we’re talking about Volusia County, Jared, why should I care? Because you have to understand Florida is leading the nation in negative real estate data. What I’m saying is our inventory is surging faster than anywhere else. Buyers are canceling in Florida at a higher number once they go under contract, which is not good for home sales.
Price cuts and the percentage of which sellers have to reduce their price in order to attract a buyer is starting to hit very big numbers anywhere you look throughout the state of Florida, all of which indicating that we ourselves are seeing a massive transition and a shift to a more buyer controlled market. Long gone are the days where sellers could demand a buyer, waive their appraisals and all kinds of things. Buyers now are a bit more concerned about the high costs that they will face when they purchase.
Now, as we speak to Daytona, you have to understand that all of these costs hit very close to home in this particular market. You’d say, Jared, what do you mean? There is no doubt that as buyers are interviewed, what they consider to be the hidden cost of home ownership absolutely becomes very visible in this particular market. It’s no surprise that insurance is absolutely expensive.
It’s further no surprise that if you own a home closer to the East Coast, you might just experience higher coverage costs for your property. Not to mention the condo crisis, which is unfolding in Florida, where at the heart you have HOA assessments skyrocketing, squeezing existing owners. Many of these people that own these properties in Daytona are snowbirds.
They live somewhere else. So they don’t have the homestead protection that keeps their property tax from absolutely skyrocketing, which is exactly the case over the past five years as property appraisers keep pushing those numbers to help them in turn pay for the high cost of schooling children and things of that nature throughout Volusia County. Not to mention the fact that these older buildings in Daytona, the older condos, specifically ones that are over three stories high, now are falling under the new laws that were changed because we had that building collapse in Miami, which is now on its own unfolding to a huge dilemma for homeowners.
And that alone is pushing massive amounts of inventory of those older buildings onto the market. And many buyers are stepping back and they’re not making a move on them, leaving them largely unsold. And again, all of these features are greater help and pushing click baity stories all across the internet about how Florida’s markets taking a dive while it is true.
The market is transitioning. You have to understand that each of these areas are suffering in their own unique ways. And you might find an area that’s completely doing the opposite.
And it’s with that goal that if you own a home here now, or you’re considering purchasing one in the future, this channel exists. And I’m going to do just what I’ve always done, particularly for Volusia County, which is a deep dive so that you fully understand how the marketplace here looks at this moment in time. And if you appreciate the hard work and effort I’ve gone to, to bring you this update, do me a favor real quick, drop down below, smash the thumbs up.
It helped the video and I thank you for doing it. Change is coming. My fellow Americans, you will own nothing and you will be happy.
All right. As I often like to do, I’d like to go ahead and give you an index, something to compare Volusia County to what better place than just to compare Volusia County with the entire state. So is Volusia County beating the narrative about Florida or is it doing worse? You’ll be the judge.
Here we go. So here we are in Florida. We’ve got closed sales.
Now this is June. This is the most recent data. Everybody’s going to ask in the comments, Jared, where are you pulling this data from? This is a password protected backend access to the Florida Association Realtors database.
I’m pulling you all the MLS data for the marketplace as we look at this. So we are at the top of the list, June, 2024 versus June, 2023. We are down in sales, negative 13%.
We are down in cash sales, which is contributing to why this number is off. If buyers, which are unaffected by the interest rate themselves are backing away from the market in a very large number, which is almost one in five cash buyers have said, I’m not here for this market this year. That’s going to cause a problem in sales in Florida and an even worse problem.
Look at this overall volume. If you just add up all the dollars that are sold in real estate, it is down nearly 10% against last year. Jared, why does it matter? Because 2023 was an abysmally slow year.
And now we’re actually trending beneath that. Now, so the key things to look at for take a look at this. And by the way, case, this doesn’t match any other data you’re looking at.
You have to understand this as single family condos and townhouses. This is the whole gambit. Look at the bottom.
We’re at 80% higher months of supply months of inventory. If you stop listing all homes in Florida, how long would it take you to sell everything off about 5.4 months? Last year, this time you would have accomplished the same thing in just three months. Now, why does that matter? Well, across the country, the entire U S is around three and a half months.
Remember, I like to have an index. If you compare Florida as a state to the rest of the country, we’re way under what the rest of the country is. Why? Because we have more unsold homes, more people are listing them.
They’re going unsold. Less closings are taking place. You just saw our closings are down by like 13%, 14%.
So as a result, that number of unsold homes stacks even higher. And here you have a much bigger leap in months of supply, by the way, the higher months of supply gets, you don’t need a huge active inventory supply. Okay.
You can look at active inventory. I’m like, well, you know, that’s definitely a lot of homes for sale. That’s unsold.
That’s as much as we had in 2019. If this number gets out of hand, it can only be as many homes as you had in 2018. If people stop buying them, the price cuts will Mount very fast and have to sell.
We’ll set new lows, which then in turn affects the value of all the homes around it becomes where new appraisals are set. And here you go. Look at this active inventory last year, folks.
Okay. Remember I just told you we’re selling less dollar volume than a year ago, but look at this a year ago, there were 96,000 units on the market this year. There’s 165,000 unsold units.
Why? Pendings are down. Pendings are down. That’s a leading indicator that in the future sales will still be down and new listings are up.
So for whatever reason, even with a lot of homes already still on the market, more people are listing than a year ago. Now, the first thing we’re going to look at is called the Daytona beach MSA. Now this really is all of Volusia county.
I like to use the Daytona beach MSA because it’s the metropolitan statistical area for Daytona covers Volusia. It’s very easy to analyze the data from this particular standpoint. And again, we’re looking at all property types, just the same.
Remember comparing with Florida, Florida was just inside of 14% year over year. Daytona has a bigger gap selling less homes, June to June against last year. Now they’re not struggling to find so many cash buyers.
They’re only down 10%. Look at dollar volume. Remember the state of Florida was down about 9.5% in dollar volume.
The Daytona beach MSA is down nearly 13% year over year. Now look all the way at the bottom. Okay.
You will see that, Hey Jared, look at that. You remember the state of Florida? It was like 5.3 months of supply against last year, which was like three months of supply. That’s something, you know, what’s going on in Daytona beach MSA.
Look at this. It’s 5.2. So it’s a little bit ahead, but remember last year it was already softening. So Daytona beach started to slow down at a greater degree than the rest of the state of Florida.
So this year we’re only showing about 60% ahead. Look at active inventory. Active inventory is 51% over last year.
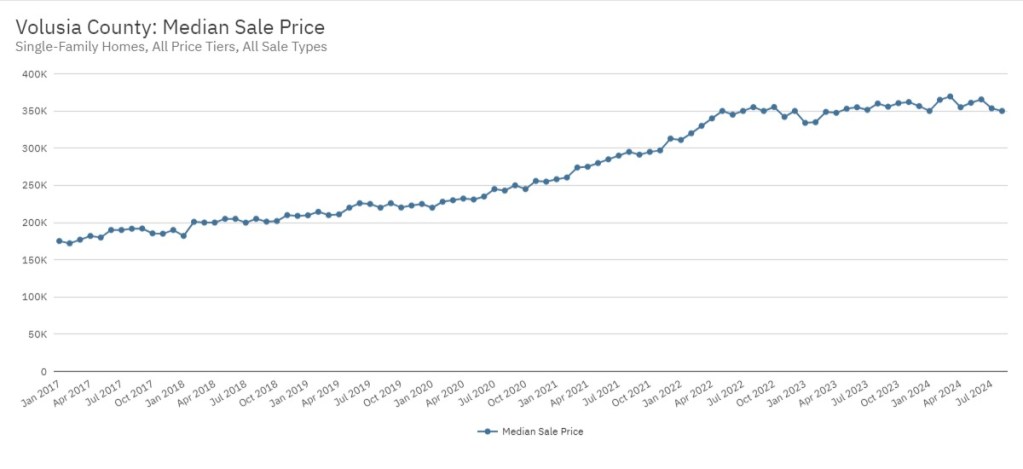
Pendings are down nearly 14%, which isn’t great, but also look at the new listing flow seems to be abating a bit. So they’re actually listing less homes than a year ago in June. Now, by the way, I didn’t mention it earlier, but median sale price is up 3.2% for the state of Florida.
You’ll notice that most of the United States is reporting 4.5 to 6% range, depending on which data you look at for the rest of the country. So it looks like, looks like median sale price is up a bit against last year, which is good. So far.
All right. The next thing I want to show you is called a home forecast tool. Now you’ll notice that everything on this graph is blue and that’s not because everybody in these areas are voting Democrat.
It’s because the app is predicting prices to fall in all of these areas. It’s cooling. It’s a buyer’s market.
That’s what the trend is. If I pull back on Florida, I think there might be one or two counties that are even balanced called neutral or towards the seller’s market. You say, well, Jared, how come Orlando is like a lighter shade of blue? Is that because there’s some Republicans in there? No, that means they’re just a little bit more towards the neutral territory than the rest of these surrounding counties.
But let’s take a look. If you look at this, you’ll say, Jared, I see. It says that this particular marketplace is a 36.
Now, how in the world do they get a 36? And I see the graph. It looks like in 2022 and 23, they were up here and upper end is a seller’s market. Okay.
This is the midpoint of the graph and what creates a seller’s market. According to this data, you can see it on the left. It tracks how much property appreciation you have is prices strong or falling.
It tracks how long it takes to sell, which is days on market. It tracks how much inventory is exploding in a given area versus its history. It’s tracking price reductions.
Obviously, if you have a marketplace where sellers are having to cut more on the price, then obviously that’s showing the buyers are having strength in a given marketplace. And lastly, it factors in mortgage rates. So mortgage rates are going to affect certain markets more because certain buyers at a higher degree will have to finance in given areas.
If you have homes in a given area that are incredibly overvalued against what the current base of population can actually afford, then that creates a dynamic where the mortgage rates heavily works against affordability, creates it more of a buyer’s chance of those homes increasing in value when it lacks affordability is not a very likely outcome. So look at what you could see here. You can see that up here, this marketplace peaked in March, 2020, the most recent peak.
Now it obviously peaked back here in July of 2021, but ever since early 2022, it’s been going straight down month after month until at some point early January of last year, this went into the neutral market territory. And then over the past six to eight months, it continued to fall steadily into the grasp of what we consider a buyer controlled market. Now you say, Jared, is this the way it is all through the metro area or some of the marketplaces stronger than others? That’s a great question.
In a second, I’m going to pull up a zip code view so you can see exactly what’s happening in this area. So here you go. You say, Jared, I see some tan spots and some clear spots and some red spots.
These are the last bastions of a more neutral market. So you’re like, Jared, what are those zip codes? Well, here they are, but I got news for you. And those of you that live here already know what I’m about to say.
No one lives in those areas. So look at the more dense areas. So if you go to the more dense areas of Daytona beach, look at these, these are extraordinarily buyer control markets.
Again, I don’t know these zip codes. Well, okay. Don’t actually, I shouldn’t say, well, I don’t know them at all, but look at this.
This is 32129. This is some of the lowest buyer controlled numbers. Meaning these are more likely to see price down than anywhere you will see in Florida, the upper twenties, like 24, 25, 26, 27. These markets, by the way, are all showing in that range.
So these are 32119, 29, 30. Look at the coastal areas. So 32118, I believe again, and then even right up north of that, those areas are shifting.
Now Palm coast, some parts are on their way. They’re not shifting as extremely as fast as these particular markets, but they are. And I will tell you that a lot of these areas that are lighter, you’d say, Jared, why is Deltona lighter? Okay.
I see it’s a buyer’s market. It’s, you know, it’s a 38, it’s a 39, it’s a 37. Why are they lighter? Well, that’s because they’re, they’re taking longer to adjust because they’re more affordable.
If you look at the income levels for these areas and you look who’s moving there versus the cost of housing, these represent a little bit lower value than all the other areas. Why? Because people moving into these areas, many of them are commuting to Orlando. If they’re not retired already, they made the option to buy here because to them, the dollar goes further.
Now, some of these areas, it is incredibly expensive versus running income. Okay. Particularly the coastline.
So like the closer you get to the coast, when income and value becomes an obstacle, who’s buying it and that’s what’s happening. So now you have more supply hitting, you have less people able to purchase it and it’s changing things for the marketplace. Now let’s take a look at home values for these areas.
Jared, how is median price doing? I own in the area. Let me pull back. So I know you’re already upset with me for, for messing with the math.
If you see these areas right here, you see Flagler beach, you see the Palm coast, they’re warm because they’re still peaking on price. Okay. So this area right here, which I don’t even know if anybody lives in three, two, one, two, four, still peaking on price, but some of these are starting to flatten out.
So this area of the coast is starting to flatten out. If you look at it, you say, what is it doing? You’re going to see it. In fact, it’s tipping, you know, so this particular end of the market is actually going into decline.
All of these are okay. You can see them, they’re hitting a wall and they’re starting to either go sideways or flatten. This is three, two, one, one, four.
This is like an eight year running graph. You can see if I narrow this down for like a three, four year run, look what’s happened in the last couple of months. It peaked and now it’s just three months of running declines.
I mean, just people are listing them cheaper than last year and they’re selling them for even less. All this is the precipitation of people in these particular areas, call a broker to put their house in the market. They sit down with the broker.
The broker says, this is the reality of this area. The seller says, well, I see that there’s a lot of my neighbors for sale and they dropped the price a little bit lower than they were last year. And then all of a sudden, by the time they negotiate a few more points off of that, precipitates price declines.

Florida Real Estate Forecast: Deltona, Volusia County, and Coastal Markets Facing Major Shifts
You’d say, Jared, well, what’s the future look like? Well, ultimately if months of supply keeps climbing and inventory keeps climbing in these areas, then you are going to see them continue on that path. Let’s take a look at Deltona.
So at the top of the Deltona graph, look at what’s happening. You’d say, well, Jared, I see that it looks like it’s just flattening out.
See that it’s almost like it went up, up, up, and it’s flattened out. This is not normal for moving season though.
In moving season, you’re supposed to gain energy and this is a seasonal peak.
It’s like top of a bell every year. That’s the way it usually looks in the summer months and normal market cycles. Every year you look at the amount of activity, homes being sold, they’re trading at that.
We just had national news saying that when we see the July pricing data, which I haven’t seen a lot of yet because it’s been released to us, it’s not released in this particular system I’m using. When we see that data catch up, you’re actually going to see negative numbers through the entire index of the United States, according to realtor.com, which is fascinating. It’s the first time it’s ever been recorded for July, which is a moving season month.
That’s the peak trading season for real estate. You’re not supposed to see this kind of stuff at this time of year.
You say, well, Jared, what does it mean? It means that in the next six months, this is going to lose ground. So I expect in a lot of these markets, I’m just going to tell you straight, these markets you see that are already blue, like Orange City, Deltona, Deland.
I think this might be Deland 32732 or 32724. Yeah, Deland split down the middle.
I see the line right here. You can see the West side cooling a little bit faster than this East side. But the point I’m making is these neutral areas that you see where it’s clear, these are going to be lightly blue.
You’re flattening out if anything. So people in those areas are probably going to start to see a little bit more inventory sell unsold.
They’re going to see price competition and will be lucky to get out really compatible to what a neighbor just sold for going into the fall in these clear or orangish areas. What will happen with these? If inventory keeps climbing and it’s unsold, these are going to pitch even lower. So you’d say, Jared, what is the opportunity here for a buyer? If you’re a buyer, these areas are going to get flatter.
A lot of these areas can understand this too. And these lighter areas right here, there’s already pockets inside of these zip codes where people are selling under prior sale.
But if you average them out, there’s also some neighborhoods selling at and slightly above, because these are literally all flat to last year. They may be up one or 2%, but these are losing value.
These are down one or 2%, which means some in these areas are selling well below last year. So some of these, when you have an entire index, if you average all the homes that sold, some of the more popular homes in here will index even those blue areas a little over last year, and they are going to do okay.
But there’s going to be a lot that are actually negotiating four, five, six. They’re trading away a lot more to sell against what the price was a year ago. So there’s significant change in the equity position of some of these homes specifically in those bluer areas.
As we go into the fall, the light blue is going to get to the dark blue. They’re going to start to shift a little darker.
Again, assuming natural market trends, you tune in here to actually understand what is happening in your market. You can see down here in the South, the price is still raging.
It looks like it’s still climbing probably off the charts. I don’t know. No, it’s not.
Look at that. It’s showing me red, but then look at what’s happening. It’s actually in a three-month decline.
I think the reason why it’s calling it red is because it’s a little above last year. So last year it’s over here, but the problem is look at the trend. So even at 32169, the trend is negative.
It’s falling. Let’s take a look at all these. Let’s take a look at a few on the coast.
Look at it flattening down. It’s actually going and dropping a bit. And we’re going into the fall.
See that this most recent month, which I’m looking at June, and 32127 posted beneath the prior month in summer. Let’s take a look at this. This is prime Daytona Beach.
No, look at this. Why is that even clear? It should be blue.
I don’t understand why it’s posting a negative. It’s like what, 339? Let’s look at year over year.
Yes, it’s negative, but all right, let me take a look. Let me show you something else.
Which I don’t necessarily know if it’s too helpful, but this is year over year.
So look, year over year in Flagler is under the zero line. See it?
For the last four or five months, Flagler’s negative to last year. Same here, 32164, negative to last year. 32136 just bounced back. So it’s been a few months negative, but 32136 is a month away from dropping right back under the line again. Look at this, look at all the South markets for the last five or six months.
It’s been pushing decent numbers against prior year. It looks like April, May, and June are writing a different story down here at the very end of that curve. And again, just to repeat, this is value growth against a year ago.
So look at this. You can see what it’s doing now.
It’s not doing so hot versus last year. Why is that happening? The entire narrative of everything we’re seeing price-wise.
The story here is it’s hanging against a year ago for the most part, but you’ll find it nearly impossible to find any zip code in here that isn’t already on a downward trajectory. It’s already tipping two, three months straight again.
We’re going into the fall.
So we’re going into the fall season. We’ve got to see how that pans out. Take a look at this. This is the value-to-income ratio.
This is taking how much the person’s salary is versus the home value for the area. So for instance, right here, it’s showing me Deltona median household income in Deltona is $71,000.
The actual home value there is pushing 4.4.
Now, why is that cold? Because 4.4 is on the lower side. Once these markets start to get at 4.9 or 5, a factor of 5, meaning I make 70 grand, but my house costs me 350,000.
That’s my typical price for my area. And anything at 5 and up, even 4.8, 4.9, you start to see those marketplaces slowing down.
So what we are now seeing, and this is all across the country, is that any of the areas that are still below 4.6, 4.7, 4.8, like Deltona, like Deland, those particular areas are mainly the most attractive because affordability is the number one problem for homebuyers. So what happens? This was the case in 2008 as well. I’m not saying this is the great financial collapse all over again, but in 2008, particularly in ’06 and ’07, when the gas started to run out of the car before unemployment went nuts and really shot up, before all that, this same pattern emerged.
Everybody flocked to areas that were not number one on their list. They were really, you know, Deltona or Deland—no offense to anybody that lives in these areas—Deltona is not the number one spot. It’s the same thing we saw with Kissimmee and St. Cloud becoming hyper-popular during the last stretch of a market cycle, because people could only afford to be there.
That was their only choice. If they didn’t move there, what would happen? They couldn’t qualify for Orlando or a more populous area over on the coast.
In Ormond Beach, for instance, that house might be 400 square feet smaller. So people think, “Okay, I can live in Deltona and get 2,000 square feet, or I can go to Ormond Beach and get 1,500 square feet.”
You see what I’m saying? Or they can buy an older house in Ormond Beach, where for the same price they could get a brand new one in Deltona. That’s the decision people are making.
But what’s happening now is that these value-to-income ratios are getting exhausted. The ratio can only stretch so far in the face of 7% interest rates.
Suddenly, it’s like enough is enough, and the ratios get out of whack. For example, in areas just south of Flagler Beach, like Flagler itself, where the ratio is running 7.3, you’ve got a big retiree population. But there’s also a lot of locals who are thinking, “Forget it, I can’t afford this anymore.”
They’re all making around $60,000, but home prices are pushing over $500,000. That’s a big problem. The same thing is happening in coastal regions all around Florida.
We’re only factoring in income versus home price here, but in Florida, that’s just the start of the story, not the end. All of these areas are also heavily impacted by rising insurance costs, skyrocketing HOA fees, and increasing property taxes.
All those factors come into play. Now let’s dive into the inventory, and I’ll show you where the price cuts are happening, then we’ll wrap this up.
Take a look at Flagler.
Here’s why this graph is important: this is an eight-year run, and you can see all the inventory dropped way down when we had easy money and low interest rates. But now, we’re seeing much lower buyer interest, and we’re getting right back to the historical average of inventory for this market.
Let’s look at Flagler 32136. Boom. It’s above its eight-year average.
This dotted line represents the eight-year average of homes for sale, and it’s now just above that.
Now, let’s look at the coastal areas of Daytona Beach 32176. Boom—off the charts.
I expected this because there’s a lot of condo chaos happening. Look how far above history this inventory is. And by the way, I checked the data—there haven’t been a bunch of new condos or townhomes built in 2024 compared to four years ago.
No, this is just unsold inventory.
Now, let’s move to 32127. Same story—above the eight-year average. Some of this could be related to the condo issue, where older buildings are getting hit with new assessments or surprise bills to bring the properties into compliance with new state laws. Buyers don’t want to deal with that uncertainty, so they’re stepping away.
Let’s check inland, in Daytona Beach 32174. Inventory is steadily rising.
It’s not as drastic as the coastal areas, but still, this is a problem when buyer applications are down by 40-50% compared to previous years. The inventory is climbing, but fewer buyers are entering the market, and that’s a significant issue.
Now let’s look at Deland West. This part of the market was hotter, so I expect less inventory here. However, this is a record high for the past eight years in West Deland. It will be interesting to see if those property values hold.
Let’s shift to East Deland. The inventory here is also above the eight-year average, but not at record highs like in the West.
I feel like the East side has been more stable price-wise, but both sides are trending downwards. It’s been on a steady climb for about eight months, but we’ll have to wait and see how it plays out this fall.
Orange City is responding a little better—it seems inventory is coming down after a decent sell-off in June, which is a positive sign.
Now let’s move to the price cuts.
Up in Flagler, we’ve got 32.4% of homes undergoing price cuts. That’s nearly one out of three homes. Further down, 28% of homes are seeing price cuts, and then we hit 34% in 32174, with nearly 40% in Ormond Beach.
In some coastal areas like 32176, price cuts are high at 30%. In 32118, we’re seeing 19.9%, which is a bit lower, but still significant.
Inland, 32114 and 32129 are showing 35% and 38% price cuts, respectively. As you head south, 24% of homes are seeing price cuts, but these areas are reacting slowly.
In places like Lake Helen, we’re seeing an eye-popping 57% of homes with price cuts. Anything above 30% is a large percentage of price reductions.
In more balanced markets, you’d typically see one in five homes with price cuts, but when you start seeing 30-40%, you know there are motivated sellers in those areas.
Well, that’s it for now. Let me know in the comments which market you’d like an update on next.
If you need help buying a home in Florida, my team and I would love to help you make a great decision with the data we provide. If you’re looking to sell in Florida, you can list your home with us for 2.5% total.
Information is on the screen. Thanks for watching, and we’ll see you on the next one!
Best Realtor in Florida - Reach Out Today
If you’re ready to make a move in Florida’s real estate market, don’t hesitate to reach out. Contact Jared Jones at 407-706-5000 (call or text) or email info@jaredjones.com for professional guidance and personalized service that will help you achieve your real estate goals.
Why Choose Jared Jones?
As a top real estate agent with nearly 4,000 homes sold and over 20 years of experience in the Florida real estate market, I have the expertise needed to help you navigate today’s evolving landscape. Whether you’re looking to buy or sell, my deep understanding of market trends and personalized approach will provide you with the insights and strategies required for success.
Stay Ahead of Florida Real Estate Trends
Unlock insider knowledge and stay informed about the latest in Florida’s real estate market! Subscribe to Jared Jones’ YouTube channel for in-depth analysis, current news, and expert insights on real estate trends across the state. Plus, check out my other channel for a deeper dive into the Orlando metro area, where I explore what it’s like to live in and around these vibrant neighborhoods. Whether you’re buying, selling, or just curious about Florida real estate, my videos will keep you ahead of the curve. Hit the subscribe button and stay updated with the most relevant real estate information!
Search Homes in Clermont, Florida


Jared Jones Real Estate Team Serving All of Central Florida
- Osceola County
- Orange County
- Lake County
- Polk County
- Seminole County
- Volusia County
- Broward County
- Marion County
- Flagler County
- Brevard County
- Pinellas County
- Hillsborough County